TL;DR.
- Introducing Holon-S1, our breakthrough model that acts as a flashlight into the “black box” of pathology foundation models, transcribing latent representations of morphology into spatially resolved genomic profiles, signalling pathways, and biological programs.
- Holon-S1 outperforms Path2Space and DeepSpot-M on gene-expression prediction from H&E.
- We demonstrate Holon-S1 applications for biomarker discovery and precision medicine across several case studies.
- Holon-S1 uncovered a novel chemotherapy-sensitivity biomarker in triple-negative breast cancer, previously known to play a role only in other cancer types.
Introduction
Tumors and surrounding healthy tissue form an interconnected biological system of gene expression, protein activity, cellular structure, and tissue mechanics. Multiple technologies have been developed to capture and quantify aspects of this system, ranging from multiplex imaging to single-cell sequencing. However, in routine clinical care, a method originating from 1877 is still the gold standard: H&E-stained microscopic tissue slides qualitatively reviewed by pathologists. Today, these tissue slides can be digitized into high-resolution whole-slide images, creating a rich computational view of tissue morphology. Pathology foundation models can then transform these images into powerful embeddings for downstream applications
Spatial transcriptomics (ST) provides a complementary view of tissue biology by measuring genomic expression profiles while preserving spatial organization. These assays can resolve molecular activity at the level of multicellular spots or individual cells, but are expensive, technically demanding, and difficult to scale
Different ST platforms balance spatial resolution against measurement stability. Single-cell assays such as Xenium/Atera (10x Genomics, Inc.) and CosMx (Bruker Corp.) provide the most granular view, but their measurements can be sparse and sensitive to limited transcript capture, dropout, and segmentation errors. Conventional spot-based assays such as Visium (10x Genomics, Inc.) produce more stable measurements by aggregating signal across multiple cells, but can obscure fine-grained tissue structure. Intermediate platforms such as Visium HD (10x Genomics, Inc.) offer a useful middle ground by measuring denser regions, combining near-cellular resolution with sufficient molecular signal to produce coherent measurements across large tissue regions.
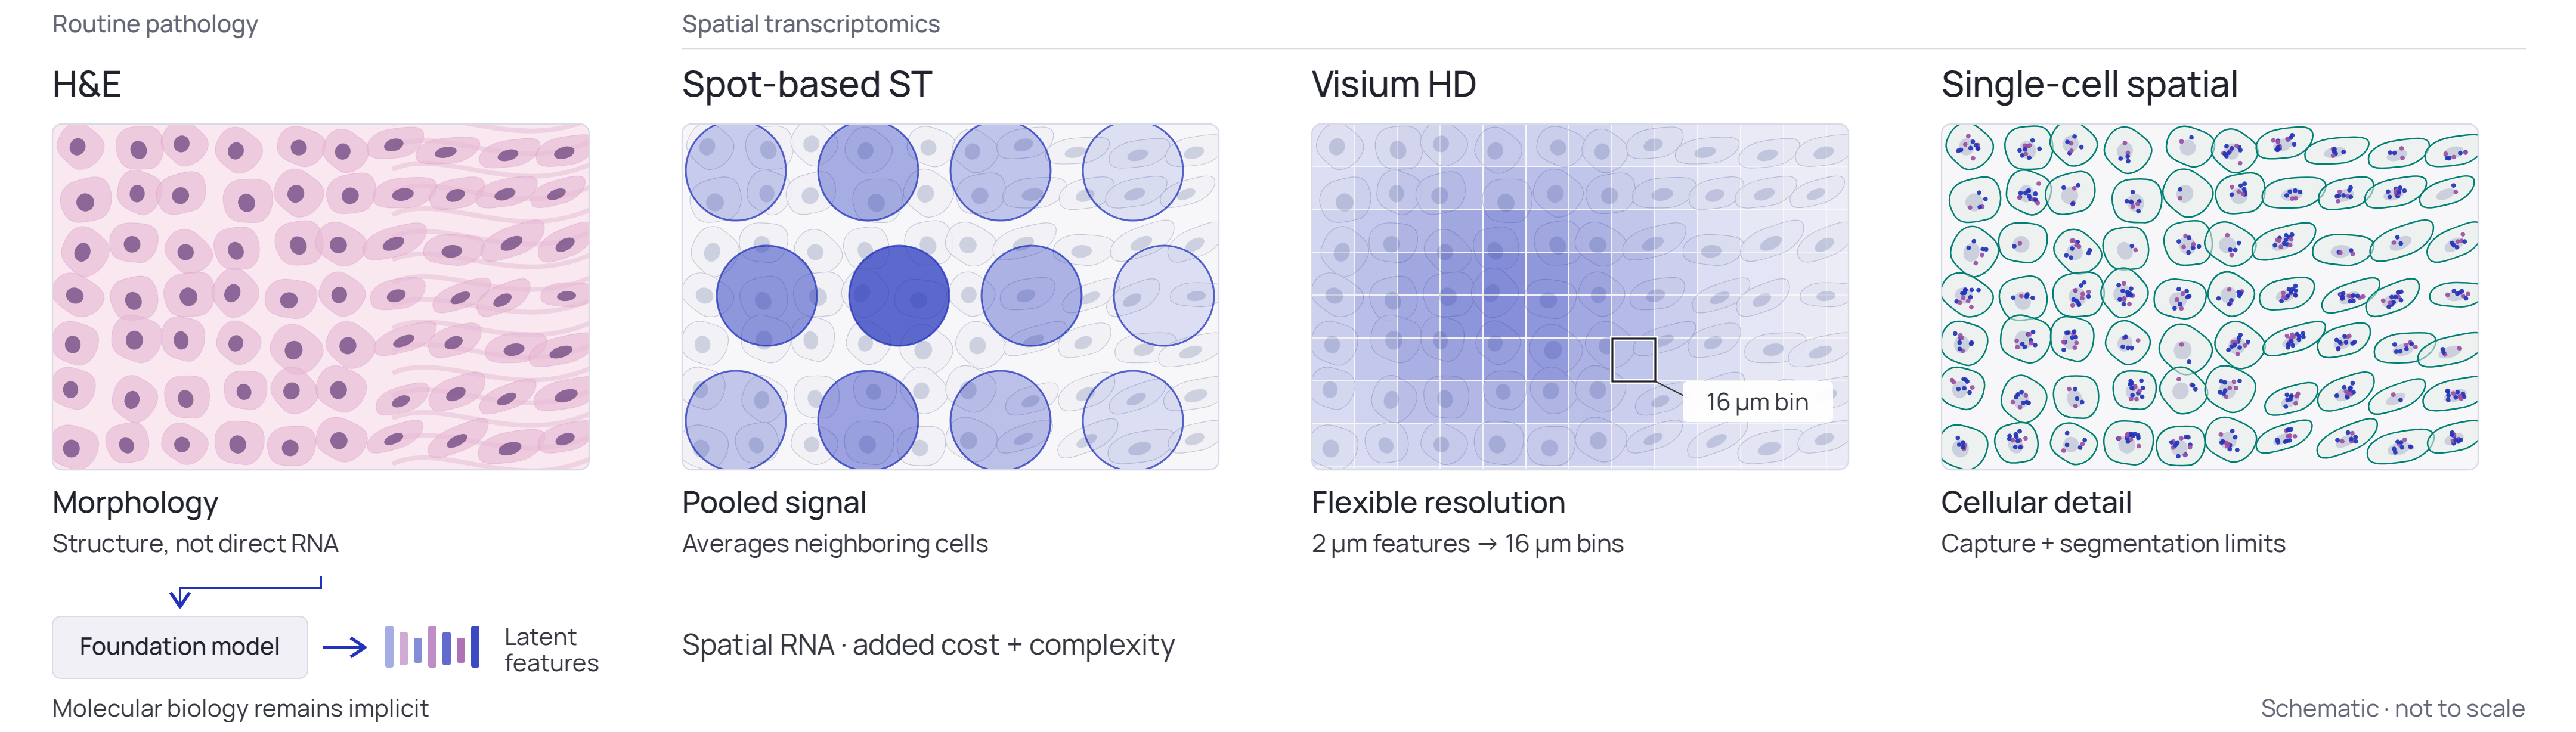
Holon-S1 predicts spatially resolved gene expression directly from routine digital pathology H&E images, offering a scalable alternative to ST in real-world workflows. We trained the model using a pan-cancer strategy on data spanning multiple assay platforms and spatial resolutions, including both spot-level and single-cell measurements. This approach was designed to capture the relationship between tissue morphology and gene expression across diverse ST panels while accounting for the trade-offs inherent to each platform.
During training, Holon-S1 integrated fine-grained cellular morphology with broader slide-level spatial context, capturing both local cell-cluster phenotypes and the larger tissue programs in which they are embedded. These complementary signals enabled the model to represent molecular activity within tumors and their surrounding microenvironments.
We evaluated Holon-S1 across a diverse set of genomic assays, including ST platforms absent from training, to assess its generalization across unseen measurement technologies. We then explored its utility in retrospective disease characterization, biomarker discovery, and translational research. In an osteosarcoma case study, we tested whether predictions derived from routine whole-slide images could recover findings previously obtained through molecular profiling, despite Holon-S1 not being trained on osteosarcoma. We also examined whether the spatial organization of predicted gene expression could reveal biomarkers associated with treatment response and prognosis, identifying novel markers for triple-negative breast cancer and localized colorectal cancer.
Case Study: Retrospective analysis of osteosarcoma in a real patient
Our goal in developing Holon-S1 was to provide patients with clinically relevant insights. To illustrate this, we retrospectively analyzed the case of Sid Sijbrandij
Inspired by Sijbrandij’s efforts to accelerate and democratize precision medicine, we tested whether Holon-S1 could use pathology images to reproduce findings and therapeutic recommendations derived from the specialized genomic panels available to him and his research team. Our second aim was to assess whether Holon-S1 might generate insights beyond genomic profiling alone. His analyses identified a distinct fibroblast program associated with remodelling of the extracellular matrix within the tumor microenvironment, potentially creating a physical barrier to immune-cell infiltration. Consistent with this hypothesis, his team measured low levels of T-cell infiltration. His tumor also exhibited pronounced MDM2 overexpression, placing it in the 99.7th percentile relative to the comparison cohort. Together with additional molecular and cellular findings, these observations provided a rationale for considering immune-checkpoint inhibition, FAP-targeted radioligand therapy directed at the fibroblast program, and MDM2 inhibition, among other therapeutic strategies. We encourage readers to review Sijbrandij's story directly on his website.
Deploying Holon-S1 on Routine Diagnostic Pathology
Fourteen digitized pathology whole-slide images (WSIs) were collected from Sijbrandij’s public database. Each WSI was partitioned into a grid of 56 × 56 μm regions, for which Holon-S1 inferred genomic profiles, producing a spatially resolved transcriptomic map of each specimen. Limiting our analysis to the eleven initial diagnostic specimens, unsupervised clustering was used to identify tumor and its microenvironment from surrounding healthy tissue, before verification by quantifying proliferation, immune, and stromal markers known to distinguish tumor landscapes. Gene-set enrichment and differential gene-expression analyses were then used to compare the tumor and its microenvironment with histologically normal tissue from the same specimens, as well as with two independent healthy bone and bone-marrow reference samples collected from Sijbrandij's database. Because matched sequencing data from Sijbrandij’s healthy tissue were unavailable, his original analyses relied on publicly available normal-tissue expression profiles from other patients. By contrast, Holon-S1 enabled tumor and adjacent normal tissue to be evaluated within the same pathology specimen.
Holon-S1 predicted higher expression of fibroblast- and fibrosis-associated genes in cancer-like regions, including FAP (fibroblast activation protein), the target of the radioligand therapy Sijbrandij received and to which the remission has been tentatively attributed. To prioritize candidate therapeutic targets, we overlaid a pre-specified panel of ten genes chosen from osteosarcoma clinical-trial and literature context; most are targets of agents in osteosarcoma trials registered on ClinicalTrials.gov. We further highlighted targets of therapies in Sijbrandij's clinical history or in development as backup options. Predicted expression was higher in cancer-like regions for MDM2 (MDM2 inhibition), KDR/VEGFR2 (vaccine), CD276/B7-H3 (antibody–drug conjugate), and CLEC14A (CAR-T). Figure 2 summarizes these findings in volcano plots: the x-axis shows the log2 fold change in predicted expression between tumor-associated regions and healthy reference tissue, while the y-axis shows −log10 of the false discovery rate–adjusted p-value. Positive fold changes indicate higher predicted expression in tumor-associated regions, and higher points indicate stronger statistical evidence for differential expression.
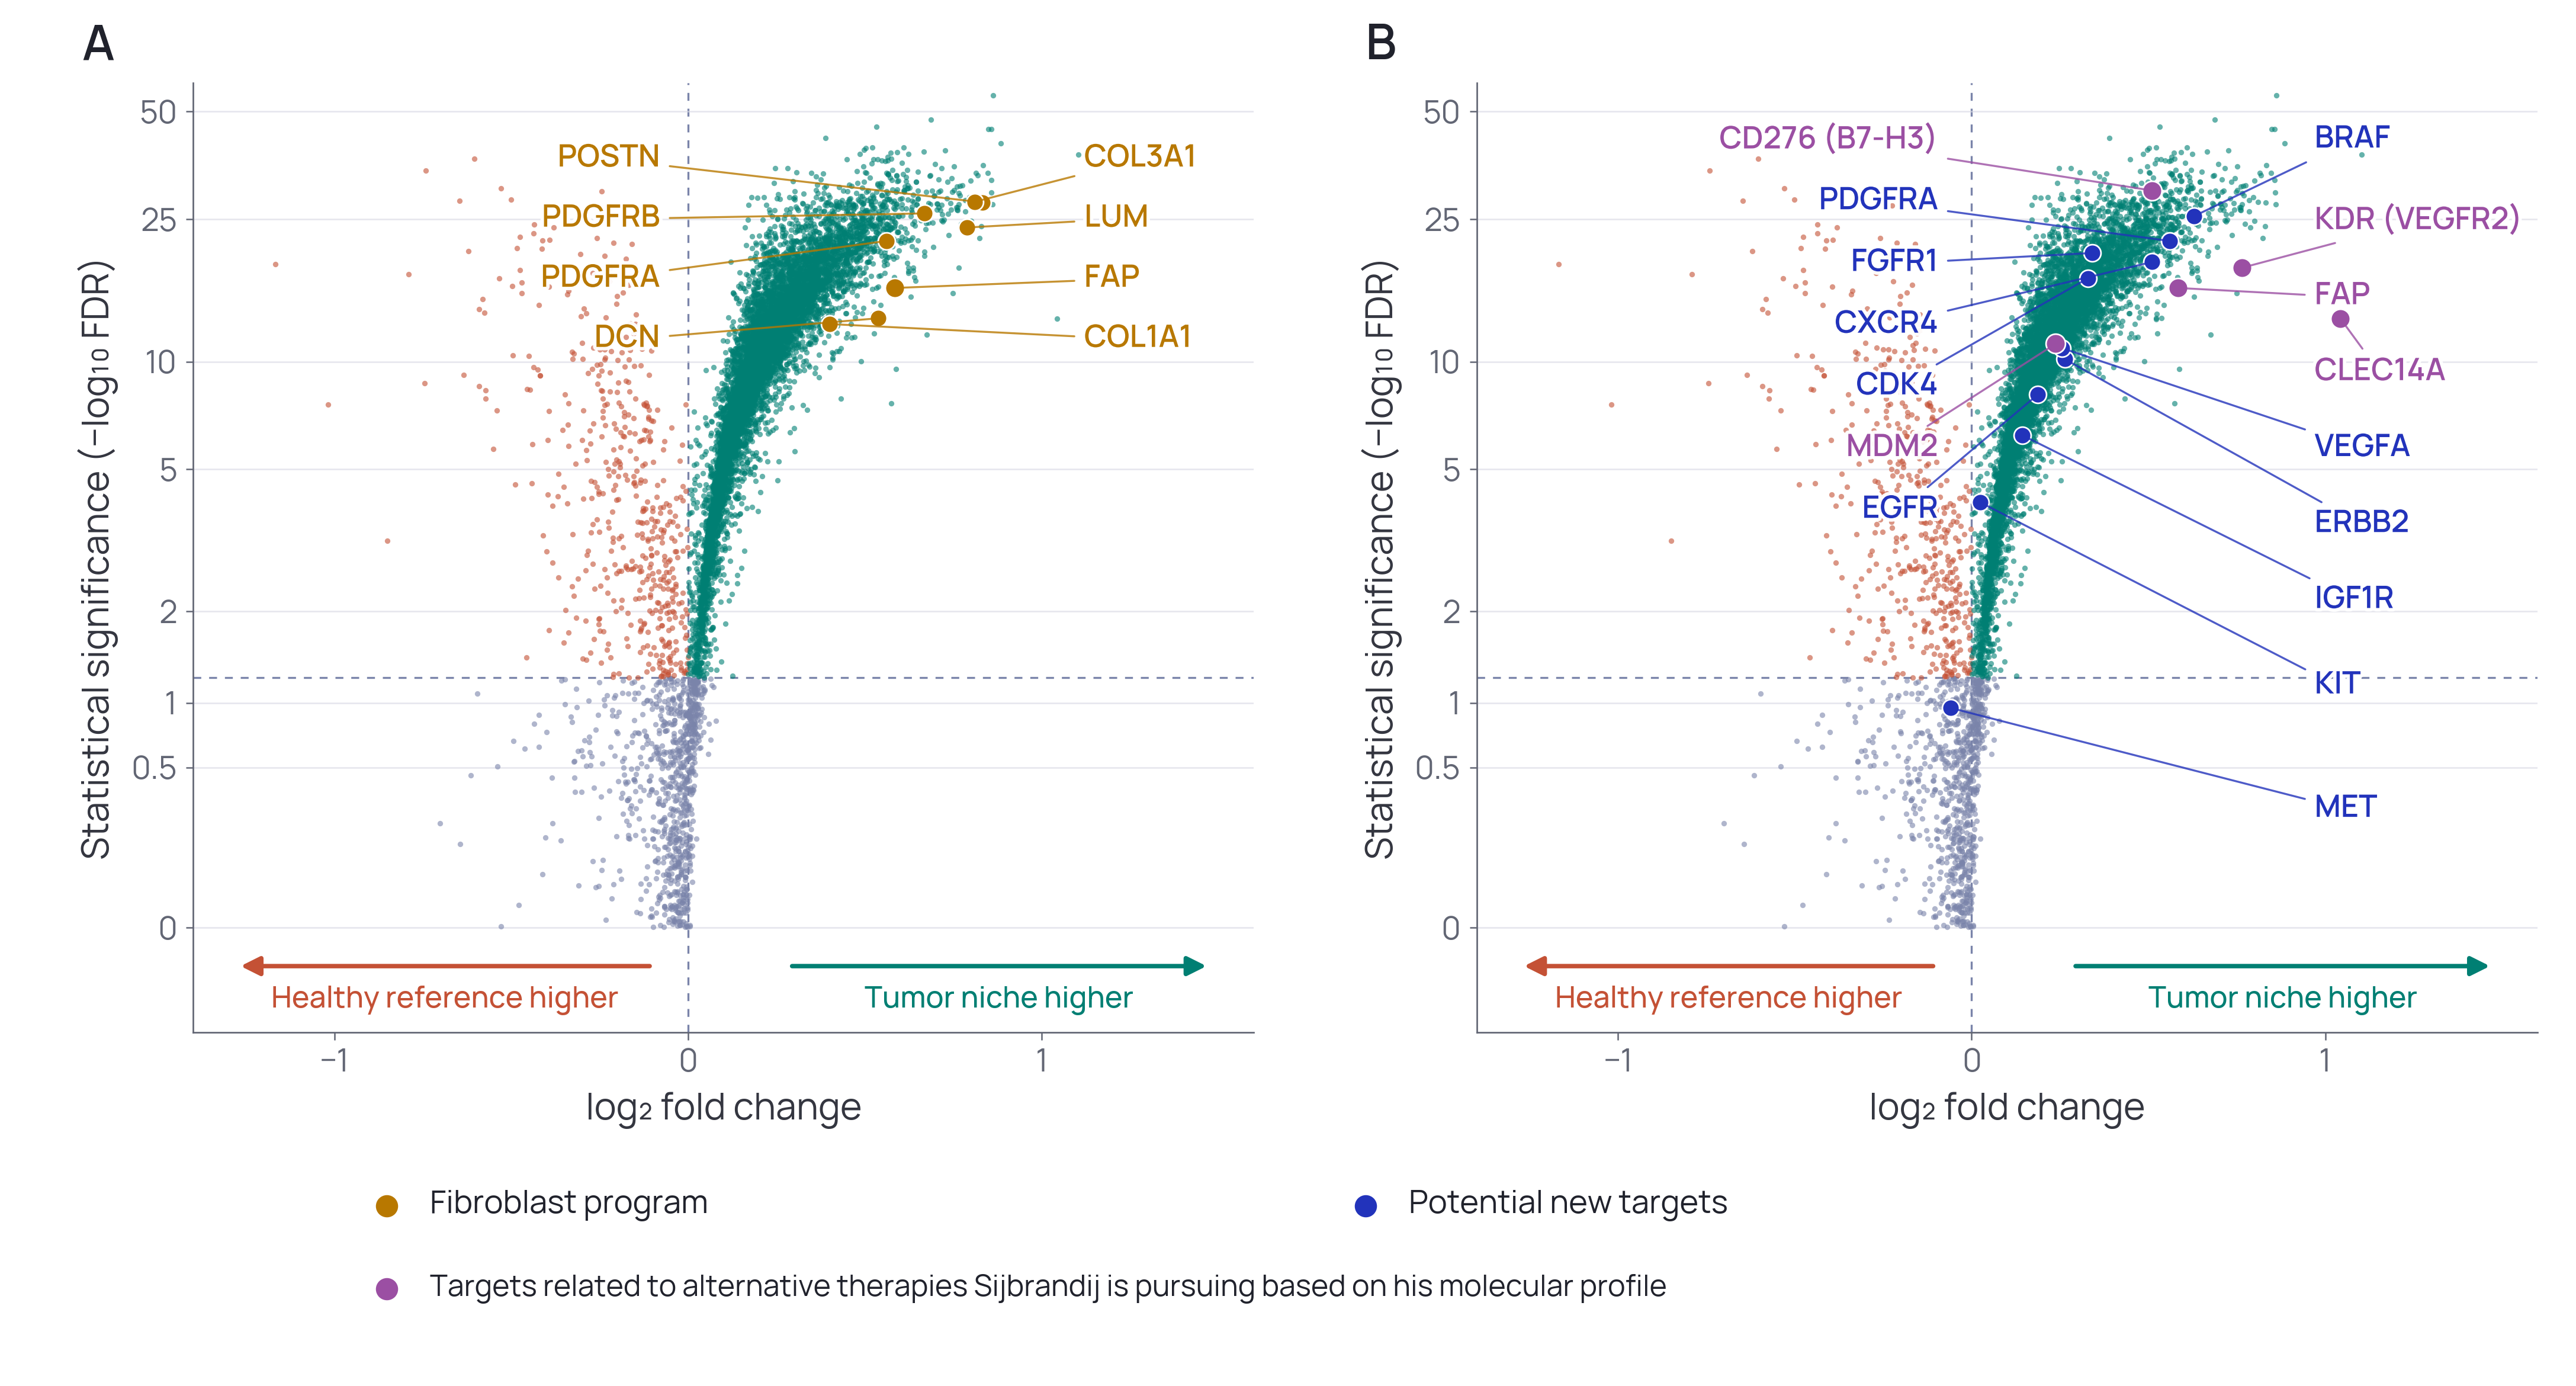
To assess whether Holon-S1 recapitulated the elevated MDM2 expression observed in Sijbrandij’s molecular profile, we compared his inferred MDM2 expression with that of an independent osteosarcoma cohort. This cohort comprised 270 publicly available WSIs from ten pediatric patients treated with adjuvant chemotherapy, accessed through Osteosarcoma Explorer
Tracking Treatment Response Through Longitudinal Pathology
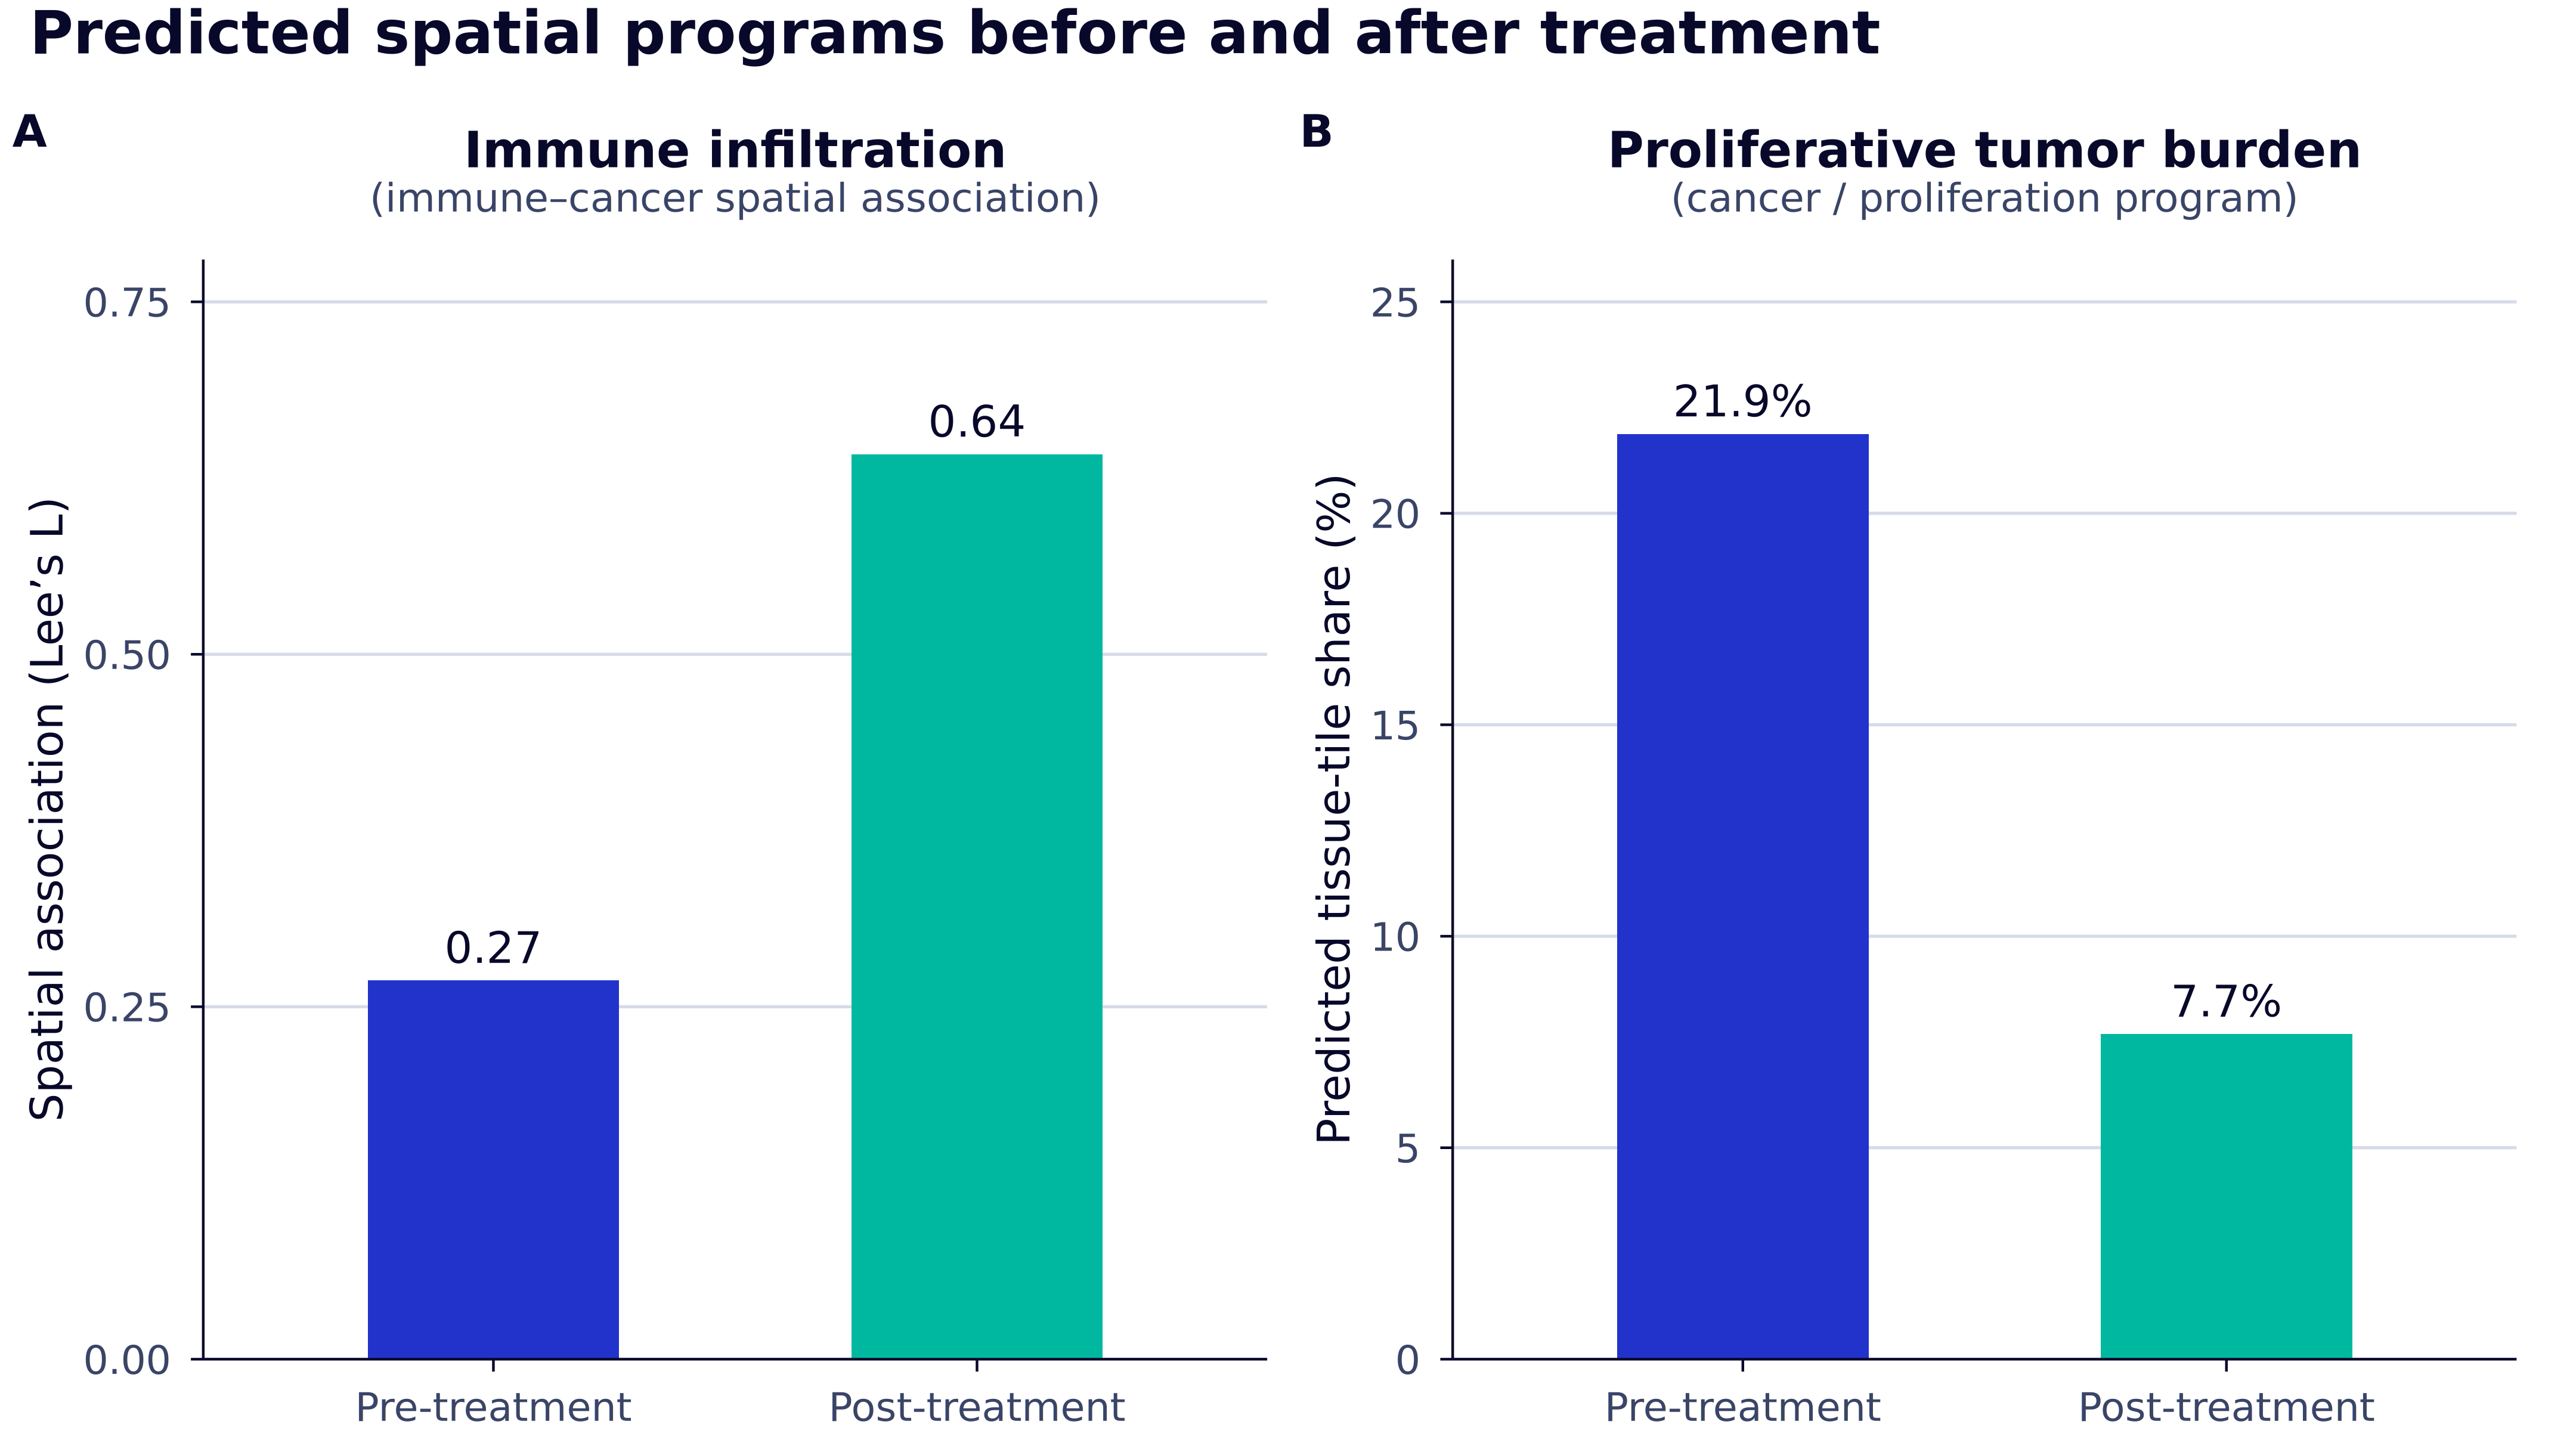
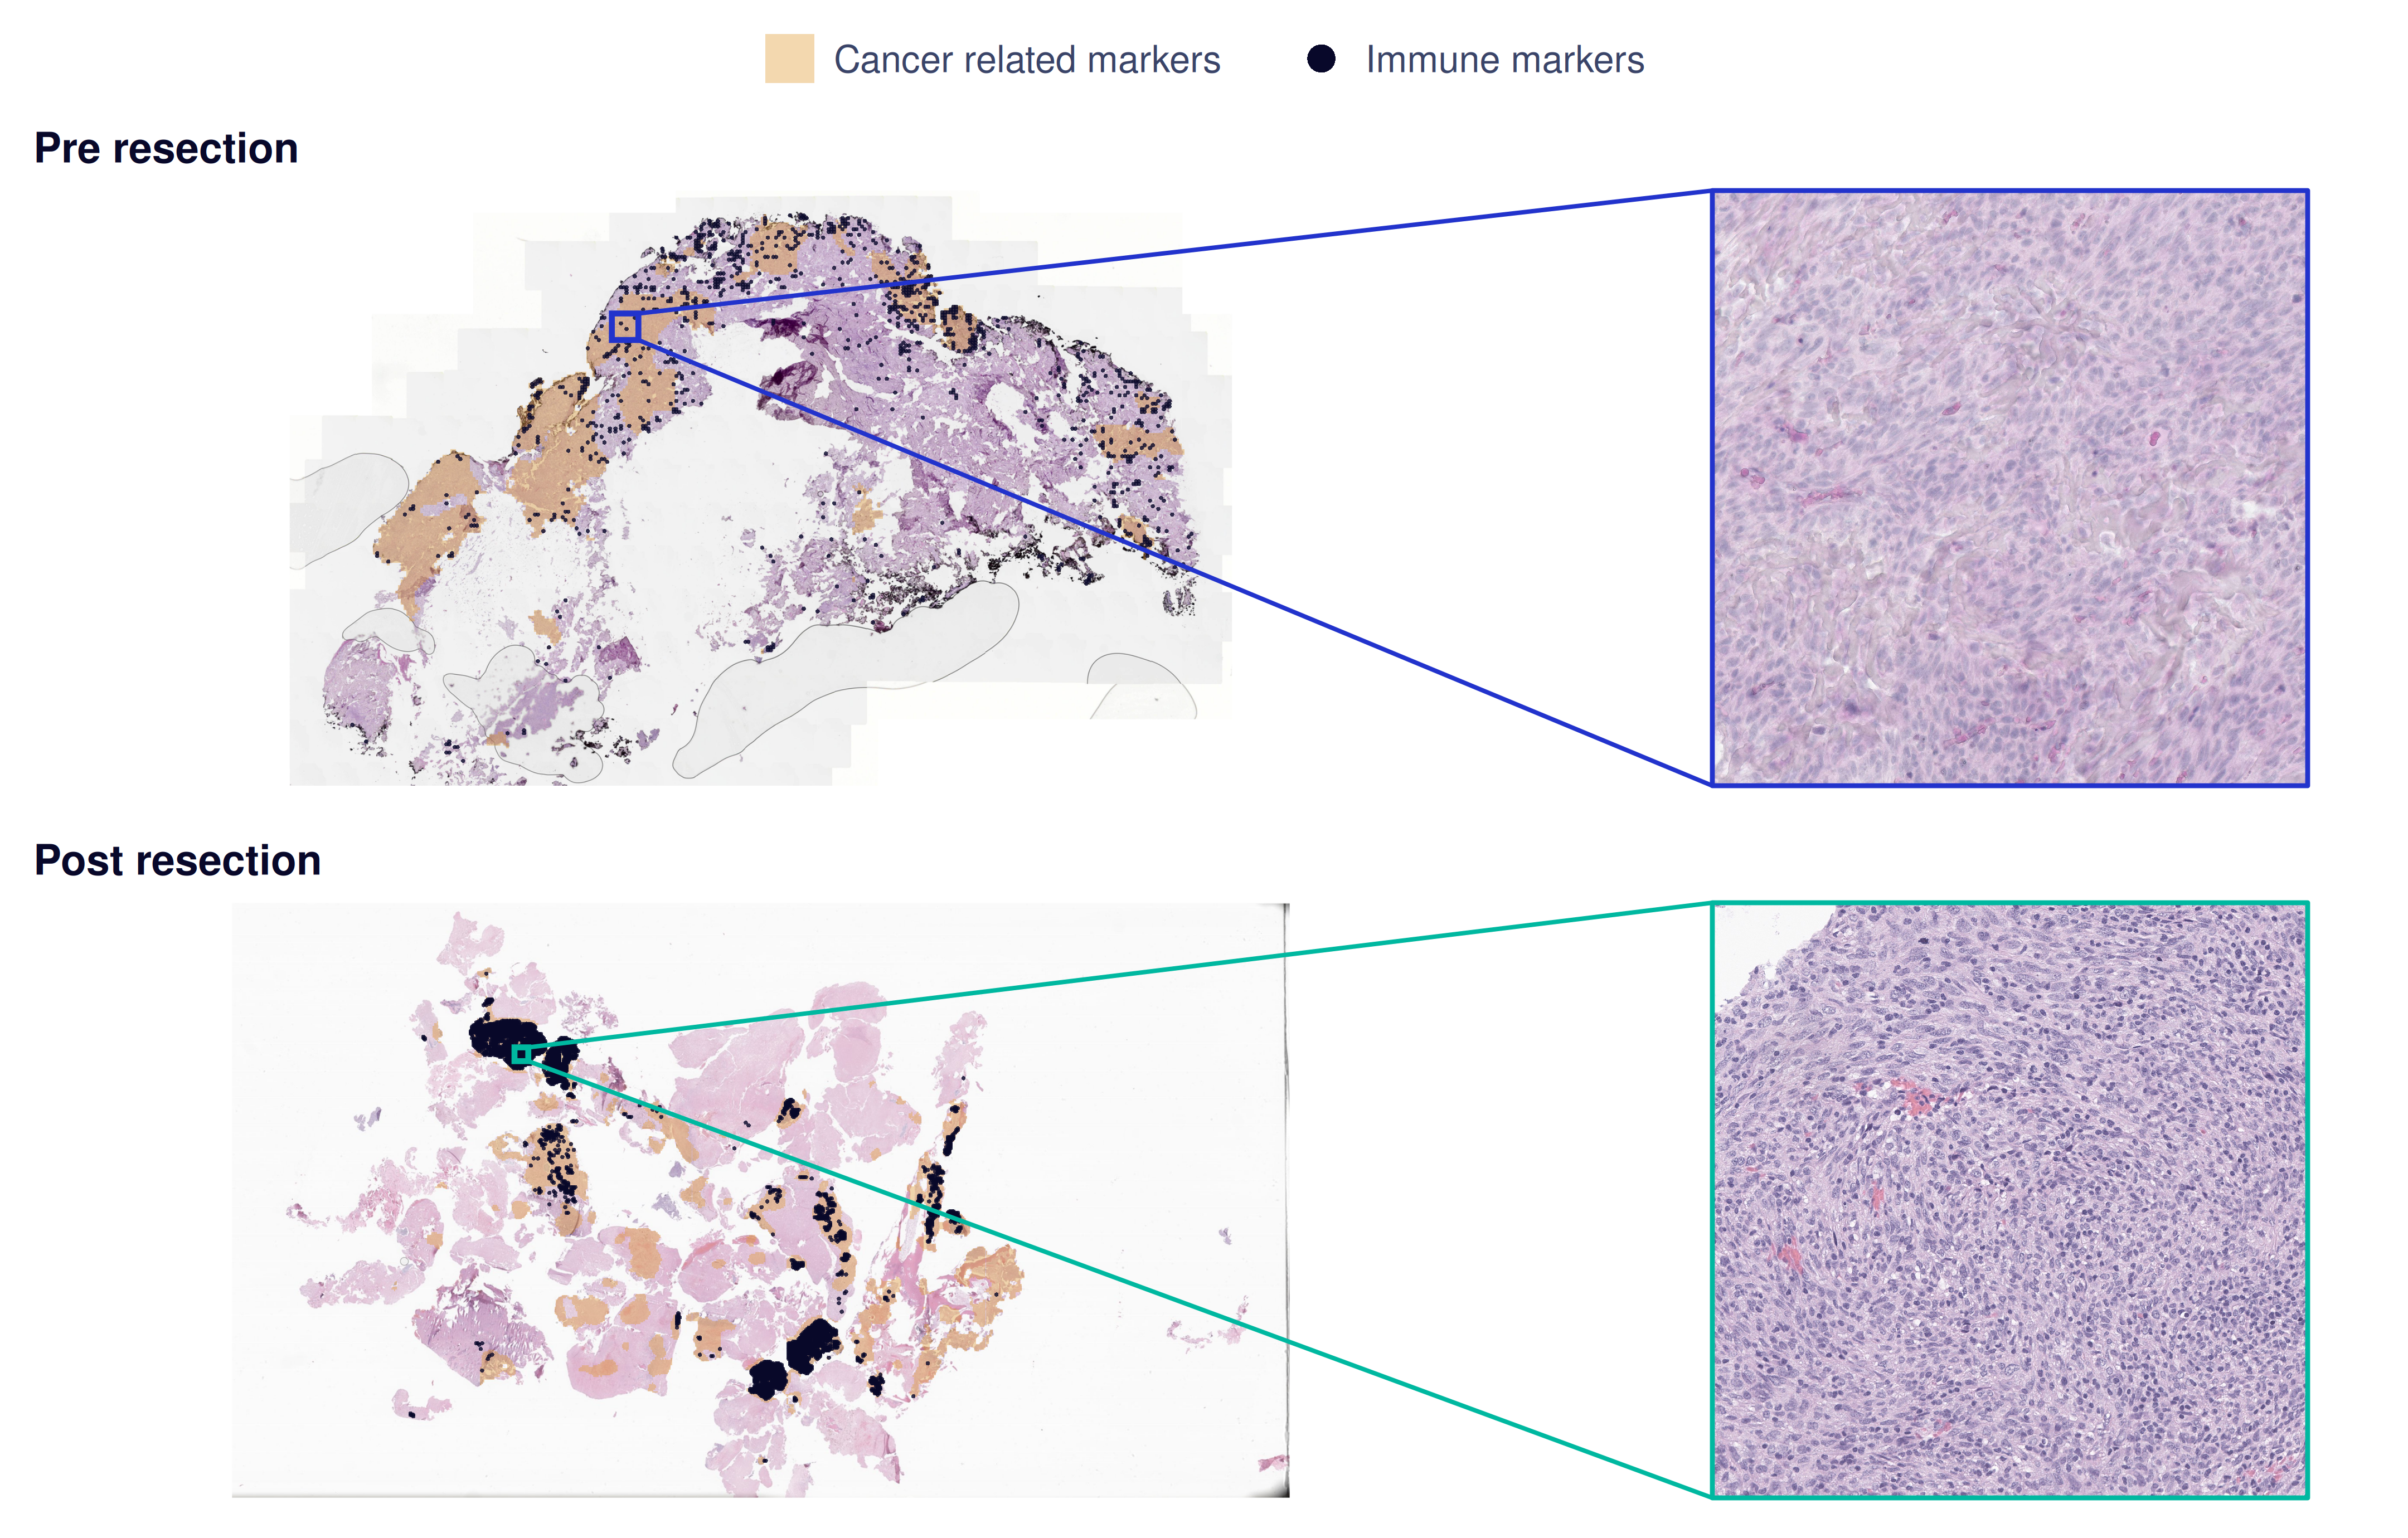
Next, we used Holon-S1 to analyze WSIs from Sijbrandij’s initial resection and a subsequent resection following treatment with several immune-checkpoint inhibitors. We quantified the spatial association between predicted immune- and cancer-marker expression (canonical programs defined by MSigDB Hallmark
Extending Immune Profiling Beyond Targeted Gene Panels
Sijbrandij’s team recently published an in-depth analysis of his Xenium spatial transcriptomic data
Reflection and Limitations
Despite the absence of osteosarcoma from its training data, Holon-S1 recovered several findings from Sijbrandij’s molecular analyses and generated additional insights directly from routine pathology images. Many specimens had been collected years before the corresponding molecular findings emerged, raising the possibility that relevant biological signals could have been identified earlier in the disease course. This retrospective analysis supports the model’s potential to generalize to tumor and tissue types not represented in training and to inform personalized precision-medicine workflows. Although Holon-S1 is currently a research-only tool and not yet approved for patient diagnosis, these findings motivate further evaluation. We are designing additional retrospective and prospective studies to assess reproducibility and establish the model’s clinical utility.
Applications in Biomarker Discovery and Translational Research
We believe Holon-S1 will play a role beyond direct patient care, particularly in the development of companion diagnostics and translational biopharma research by accelerating interpretable biomarker discovery. Here, we demonstrate the discovery of simple predictive and prognostic markers which deliver actionable insights into triple-negative breast cancer and localized colorectal cancer.
Spatial Organization for Biomarker Discovery
Predicting Response to Neoadjuvant Chemotherapy in Triple Negative Breast Cancer
Patients with triple-negative breast cancer (TNBC) are often candidates for neoadjuvant chemotherapy (NAC). Currently, pathologists quantify immune markers in a patient’s tissue to help determine whether the patient will respond to NAC or should consider alternative treatments. Unfortunately, this immune assessment lacks precision and is subject to inter- and intra-observer variability
We assembled TNBC cohorts with WSIs from IMPRESS
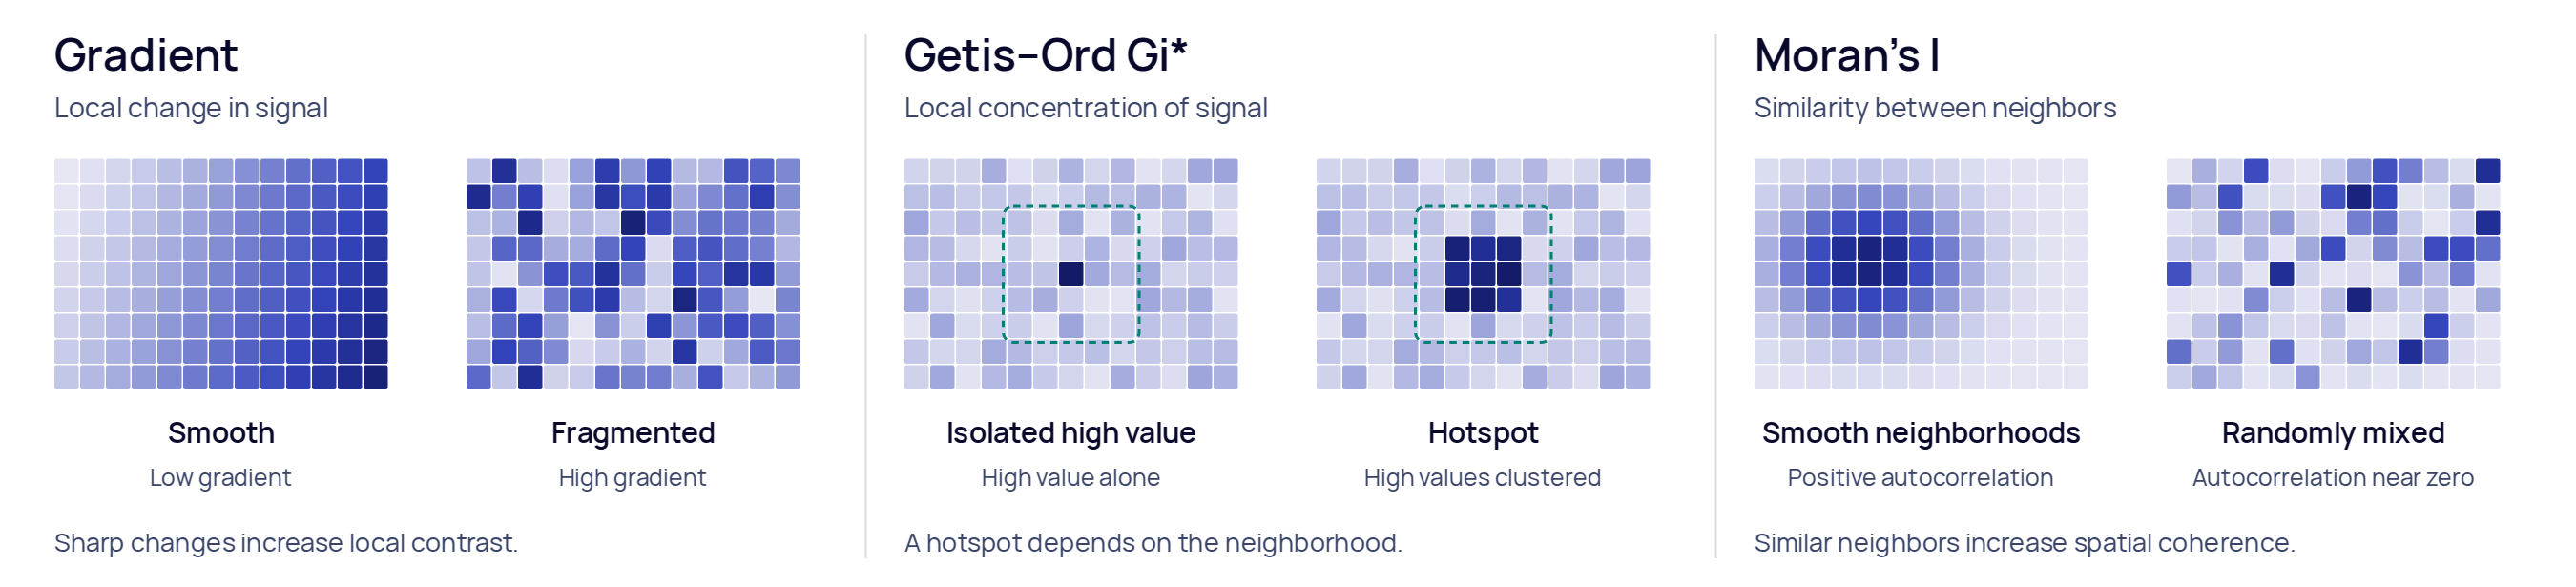
We investigated whether the spatial organization of gene expression predicted by Holon-S1 could identify markers of treatment response in TNBC. We restricted the analysis to genes meeting our prediction-confidence criteria in breast cancer (see Validating the Language of Holon-S1) and quantified local expression variation (gradient), spatial clustering (Getis–Ord), and spatial autocorrelation (Moran's I; Figure 6). In the IMPRESS discovery cohort, we evaluated each gene–metric combination using univariate models and five-fold cross-validation. EREG gradient (gEREG) emerged as a candidate marker associated with pCR and was subsequently evaluated in the TransNEO test cohort.
To provide a pathology-based clinical baseline, we generated computational estimates of stromal tumor-infiltrating lymphocyte (sTIL) percentages, a measure conventionally estimated visually by pathologists
We summarized precision–recall performance using average precision, with five-fold out-of-fold predictions in IMPRESS and IMPRESS-trained models applied to TransNEO. Separately, we fitted univariate and multivariate logistic regressions within each cohort to estimate odds ratios (OR), 95% confidence intervals, and likelihood-ratio p-values. Multivariate models included both gEREG and sTIL. Odds ratios were expressed per one discovery-cohort-computed standard deviation increase in each feature.
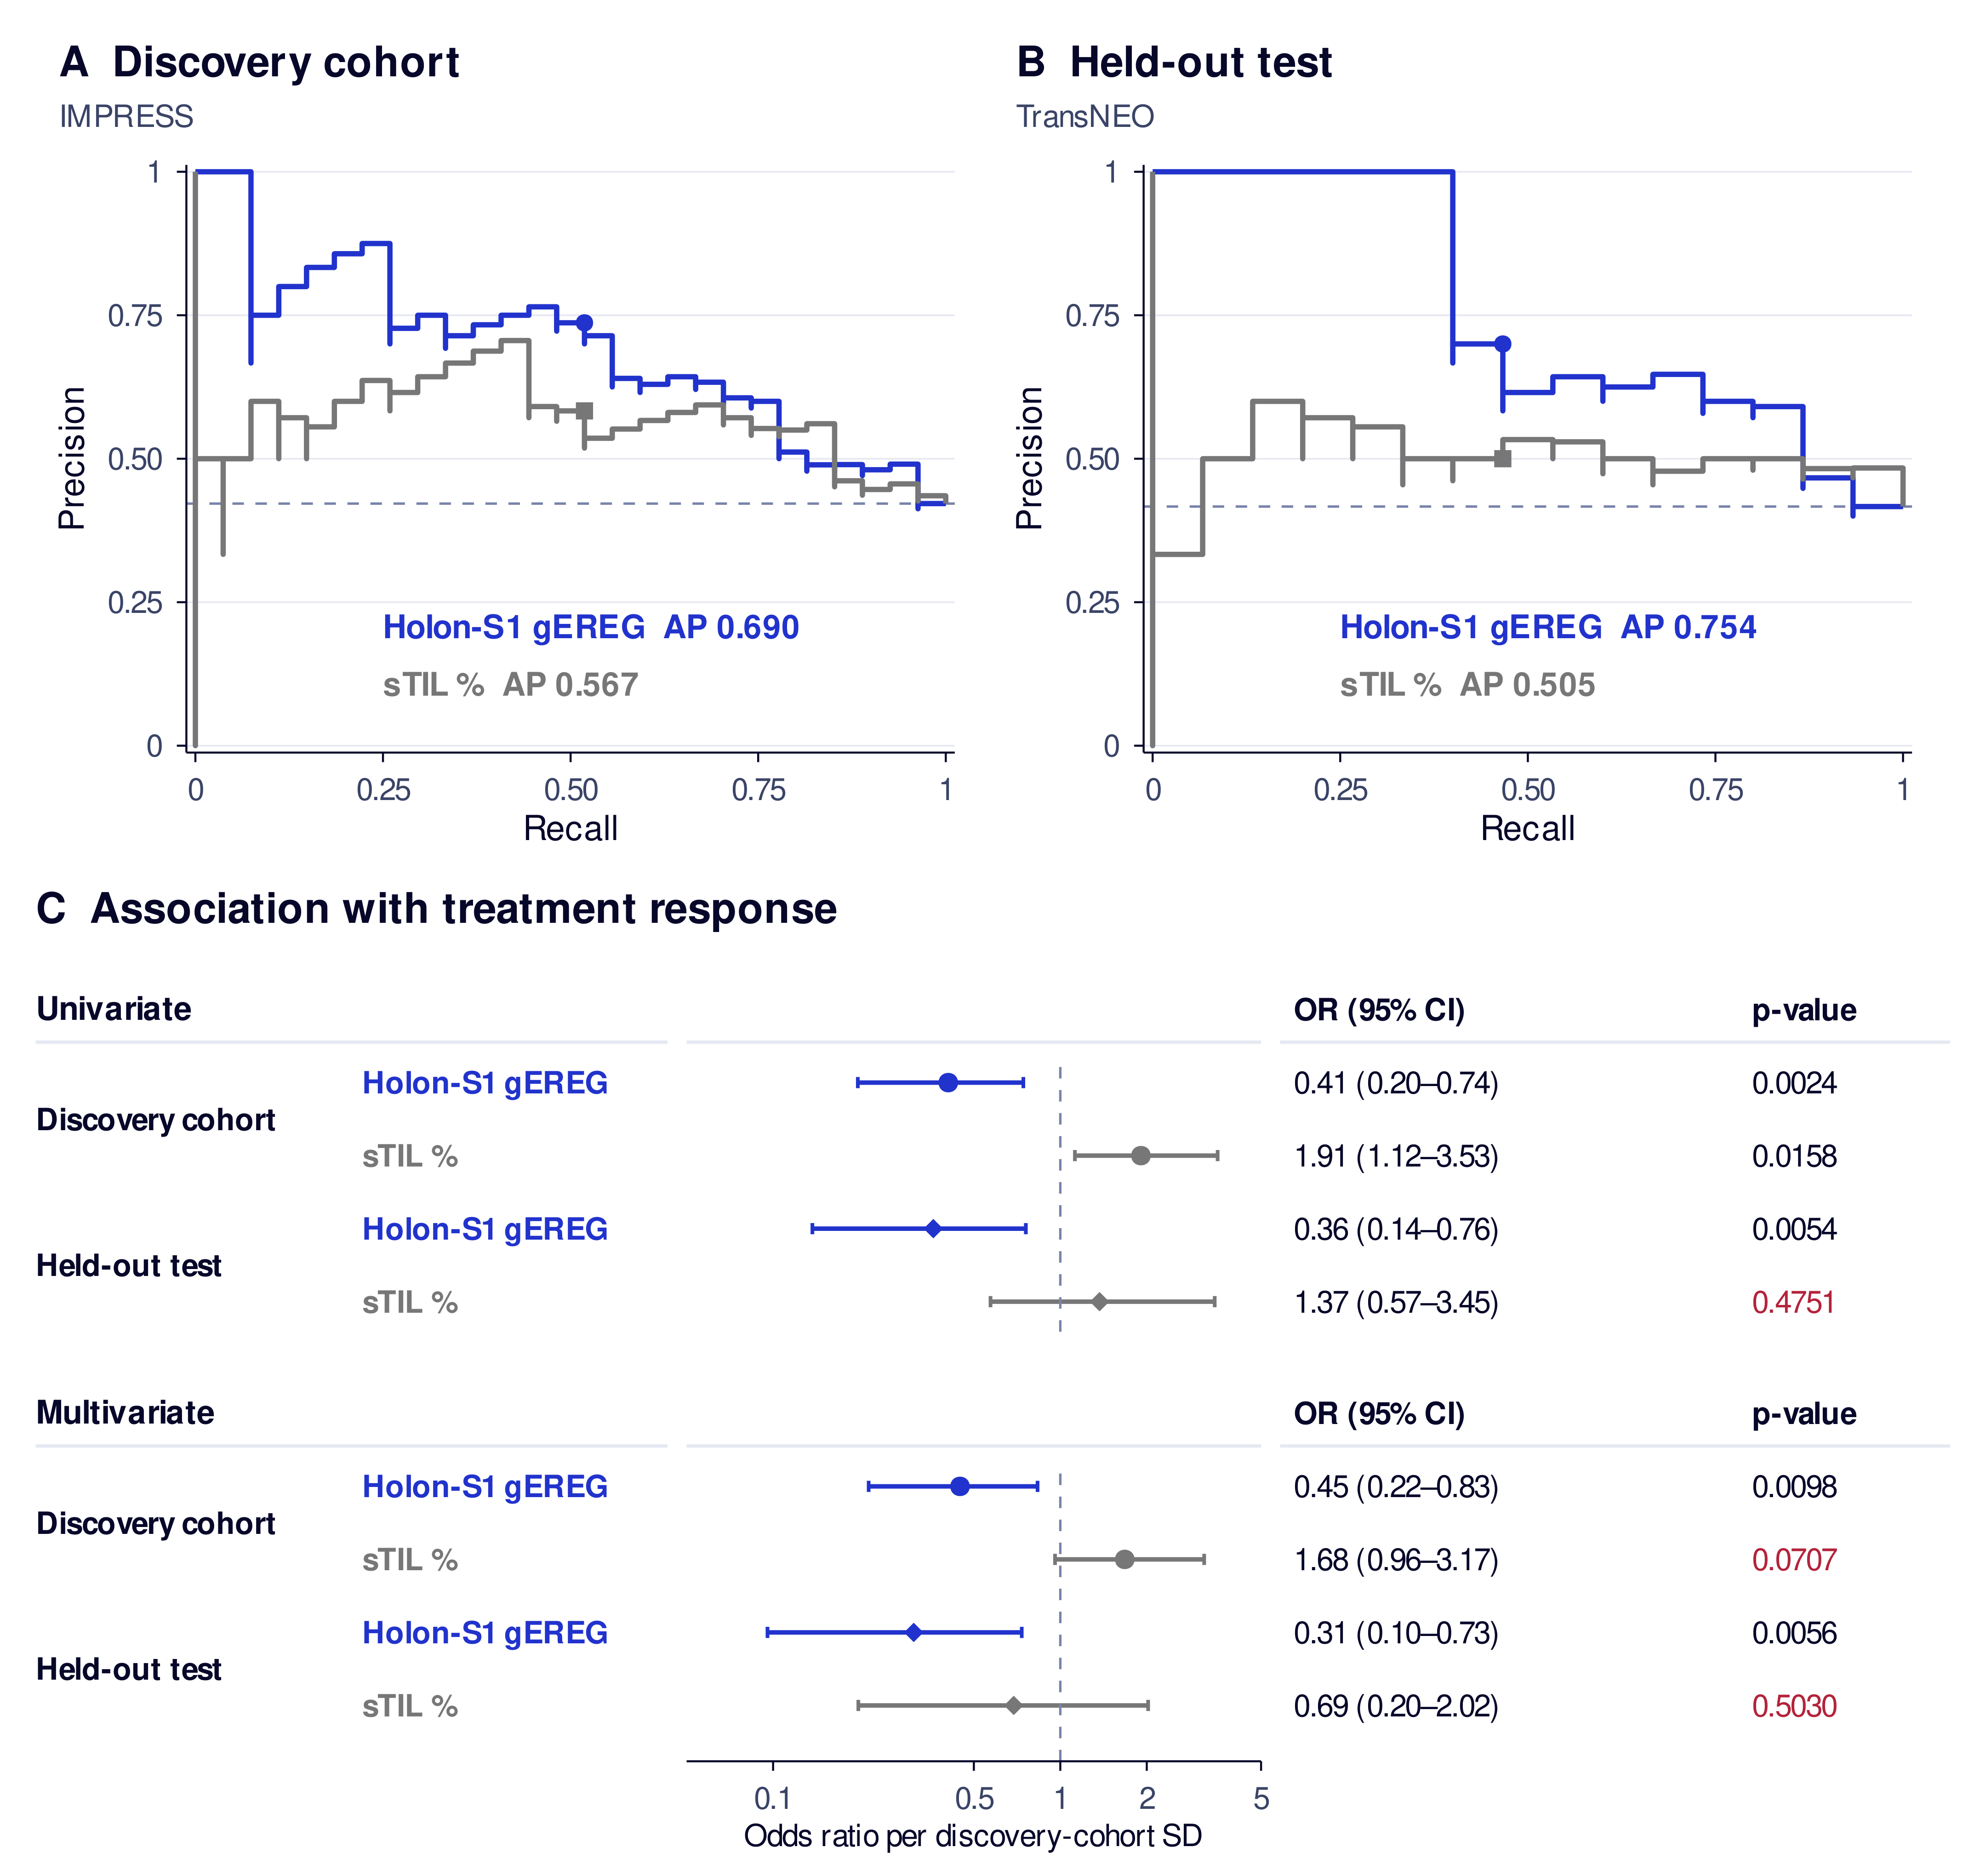
gEREG remained a significant predictor in univariate modelling and in multivariate modelling when adjusting for sTIL. sTIL was unable to significantly predict pCR in the held-out test cohort and did not maintain significance in multivariate modelling. Previous studies
Interpretable Spatial Biology for Translational Research
Prognosticating Localized Colorectal Cancer
Spatial colocalization describes whether two biological programs, represented by gene-expression signatures, are active within the same tissue neighborhoods or occupy separate regions. We quantified this relationship using Lee’s L, with positive values indicating spatial alignment and negative values indicating segregation. Using Holon-S1-predicted expression maps, we evaluated predefined pairs of programs spanning hypoxia, metabolism, inflammatory signaling, vascular biology, proliferation, stroma/EMT, cytotoxic immunity, and cancer epithelium for associations between their spatial colocalization and disease-specific survival in non-metastatic colorectal cancer (CRC). Programs were computed by averaging genes at each spatial location following canonical MSigDB Hallmark
We used TCGA-COADREAD
Within the discovery cohort, we assessed each pair’s association with disease-specific survival using a continuous Cox proportional hazards (CPH) model and five-fold cross-validation. This analysis identified proliferation–stroma/EMT (epithelial–mesenchymal transition) colocalization as a prognostic feature: greater spatial segregation of these programs was associated with better disease-specific survival. The association showed the same risk direction in the held-out SurGen cohort.
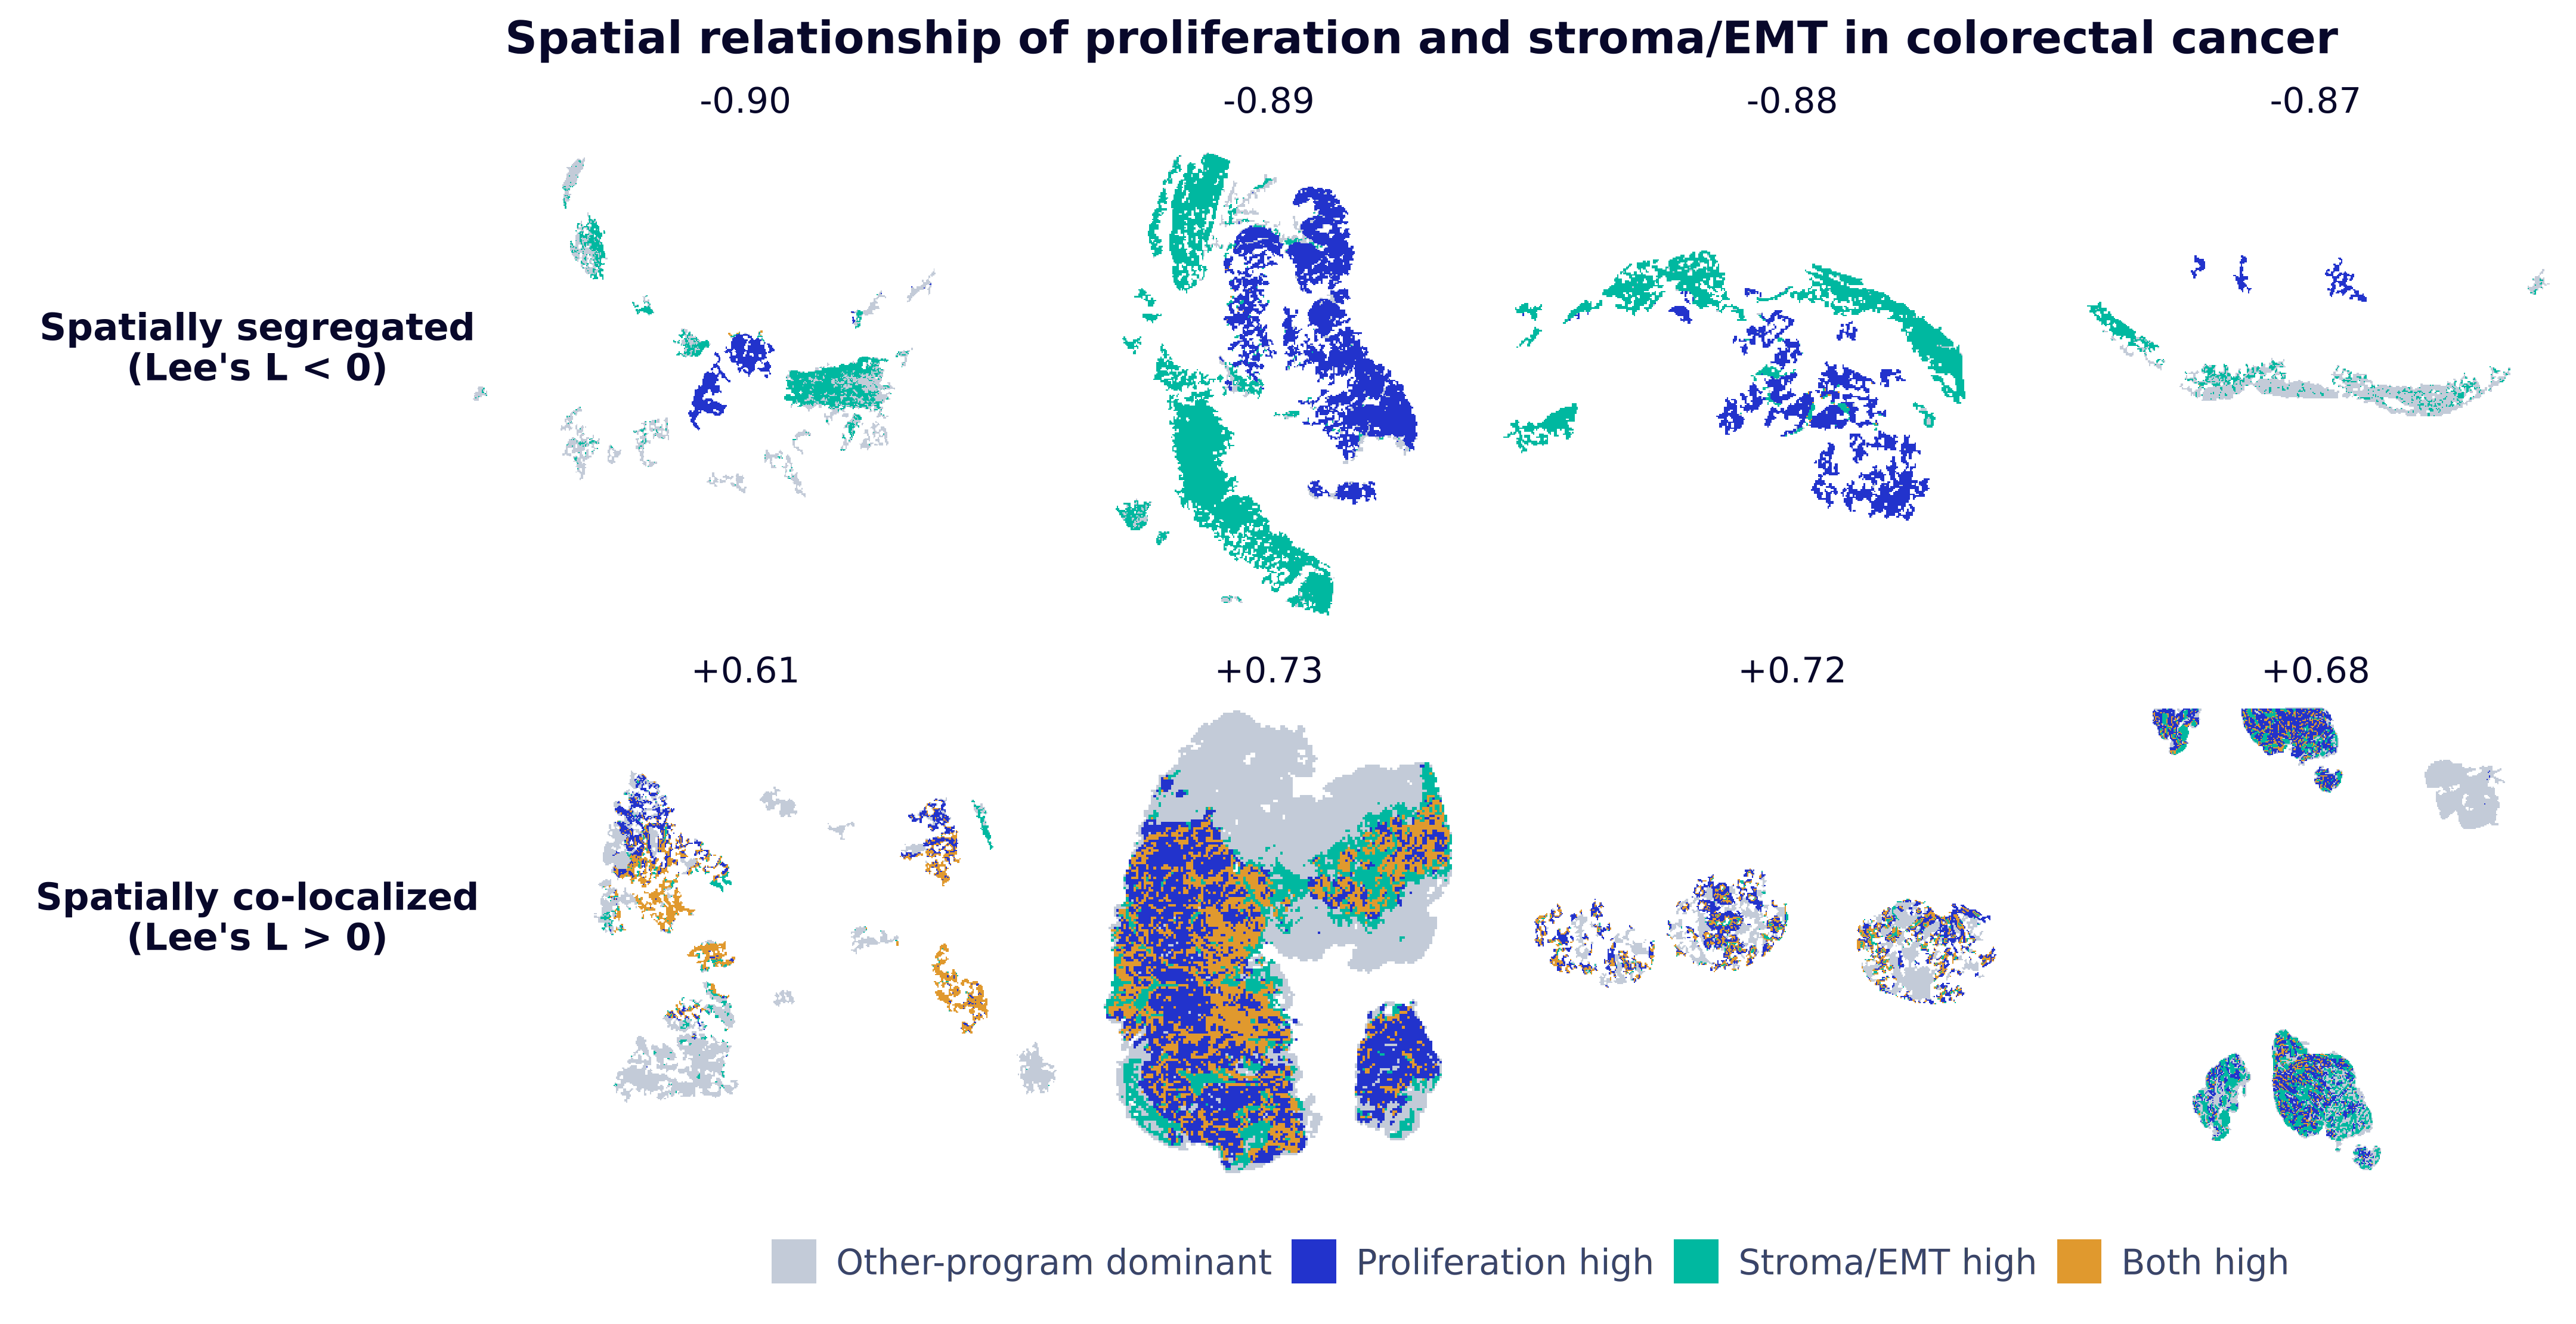
To visualize survival differences, we divided patients into lower- and higher-colocalization groups based on their Lee’s L scores for the proliferation–stroma/EMT pair, constructed Kaplan–Meier curves, and used CPH models to compute categorical hazard ratios. Log-rank tests indicated significant differences in disease-specific survival between the groups.
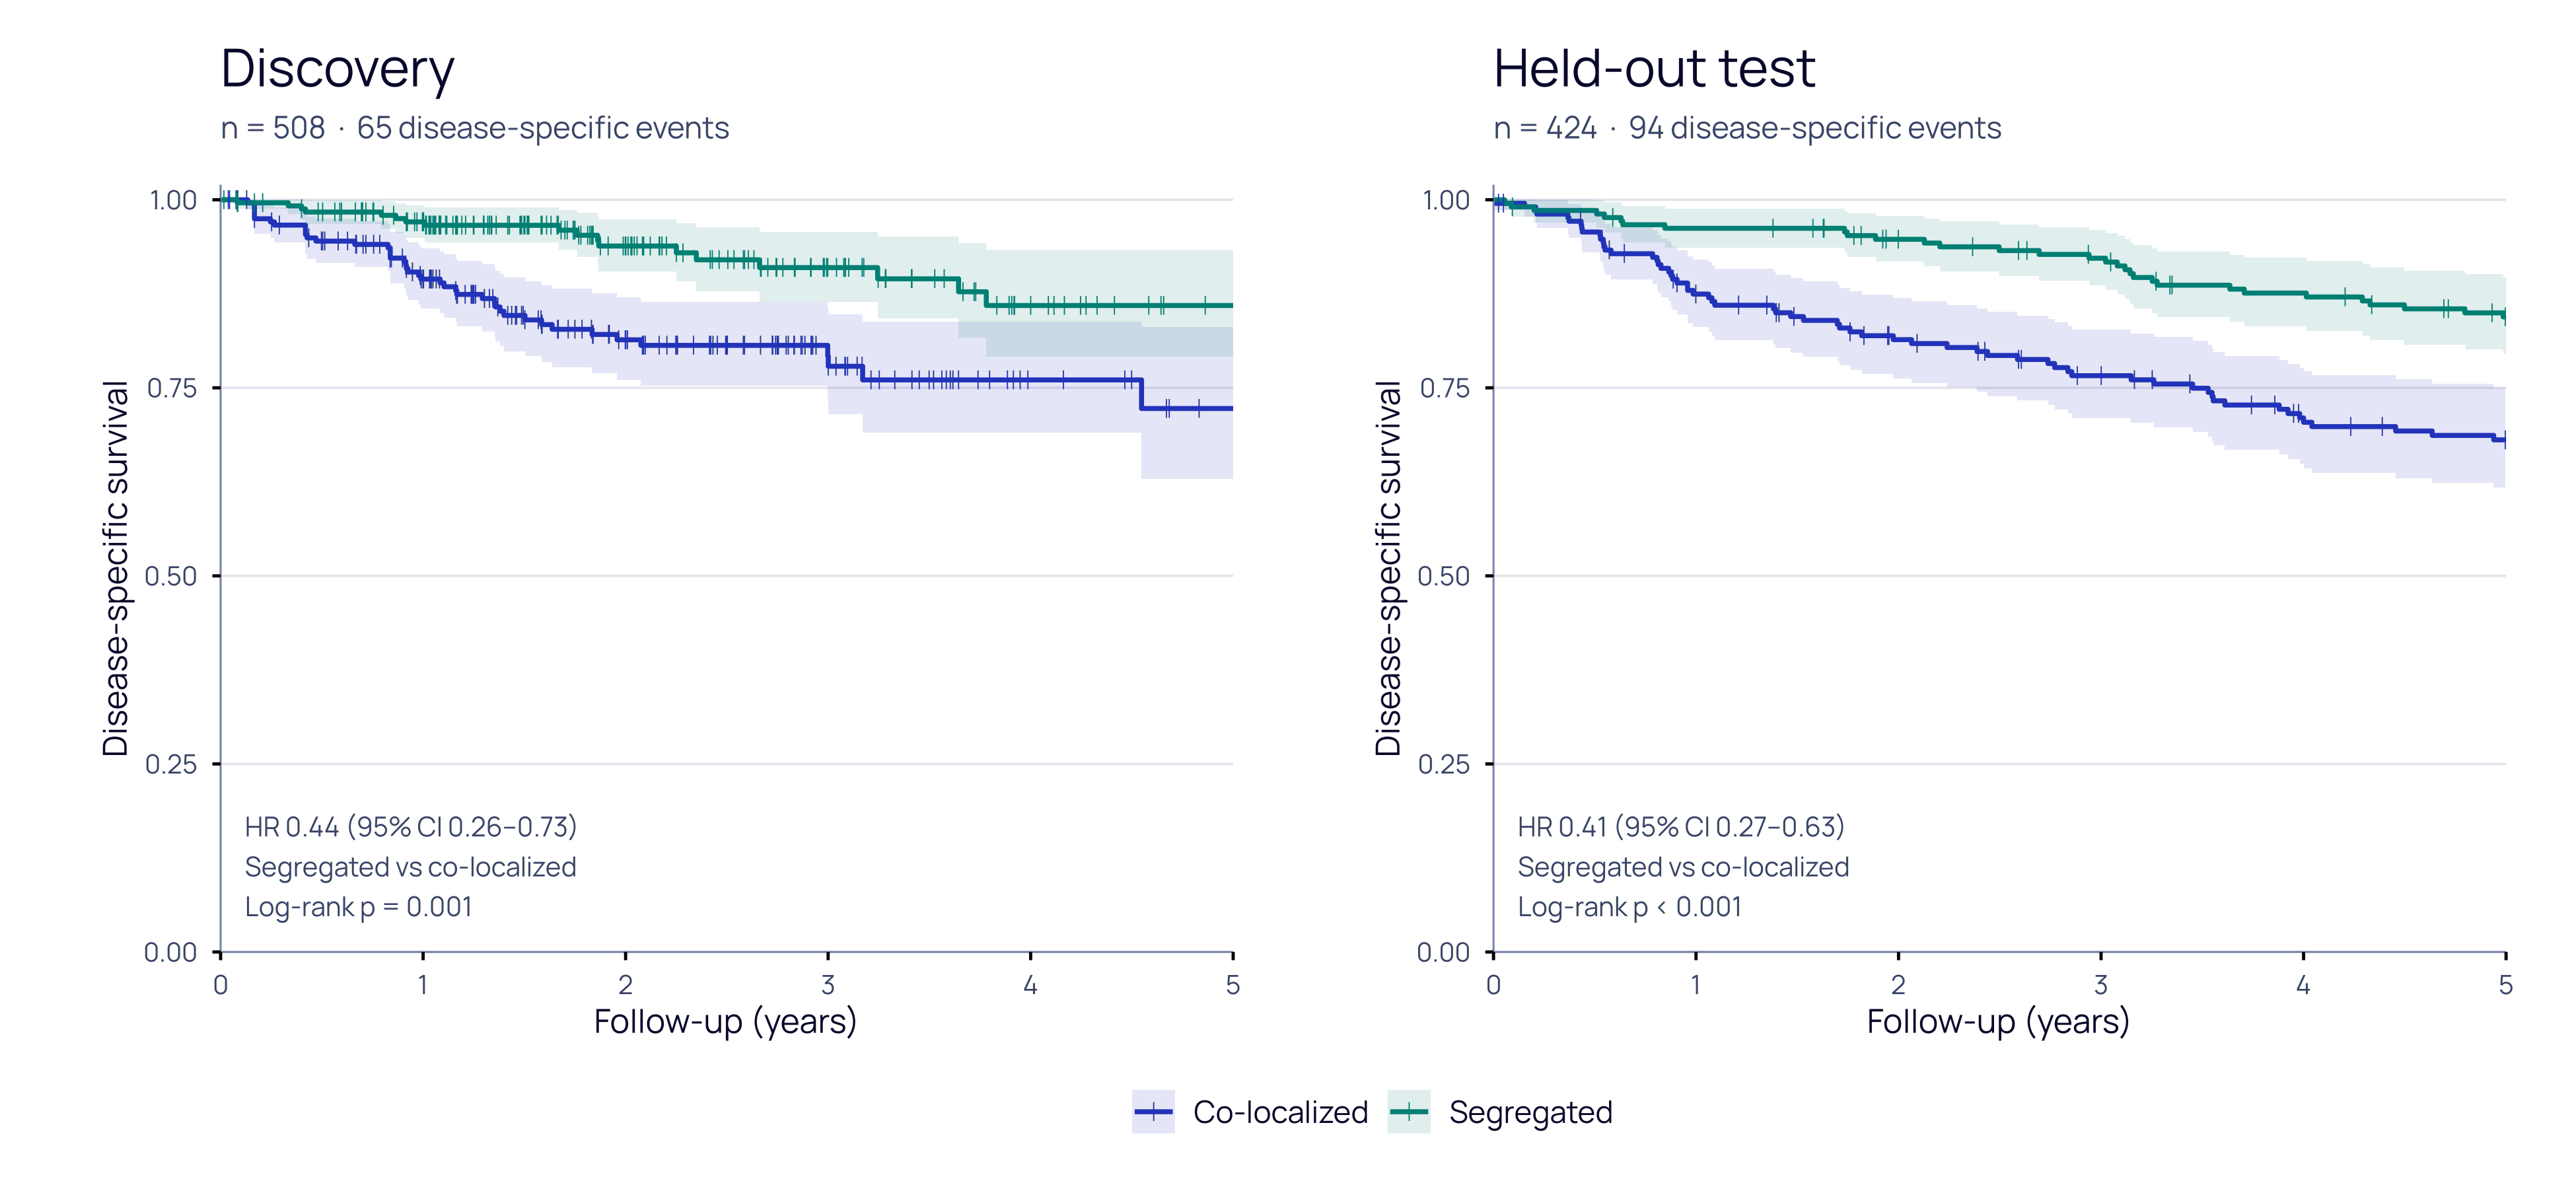
Our findings identify spatial colocalization of proliferation and stroma/EMT signatures as a candidate prognostic marker in localized colorectal cancer. This observation adds a spatial perspective to established evidence linking stromal activation and mesenchymal expression programs to poor prognosis
Validating the Language of Holon-S1
This year, several studies have demonstrated the promise of predicting transcriptome-scale gene expression directly from H&E images
Technical Validation of Gene-Expression Prediction and Gene Curation
Our first finding was a consistent trend between the technological generation of the spatial transcriptomics platform and measured concordance: predictions evaluated against newer, more advanced platforms consistently achieved higher accuracy. Figure 10 demonstrates this observation. Although Xenium 5K (10x Genomics) was the most recent platform represented in Holon-S1’s training data, validation on Atera (10x Genomics), released this year, yielded a higher median Pearson correlation coefficient (PCC) than any Xenium sample. This suggests that lower performance against older platforms may partly reflect noise or uncertainty in the reference measurements rather than weaker model predictions. Comparisons between virtual transcriptomics models must therefore account for the sensitivity, resolution, and measurement characteristics of the assays used for validation.
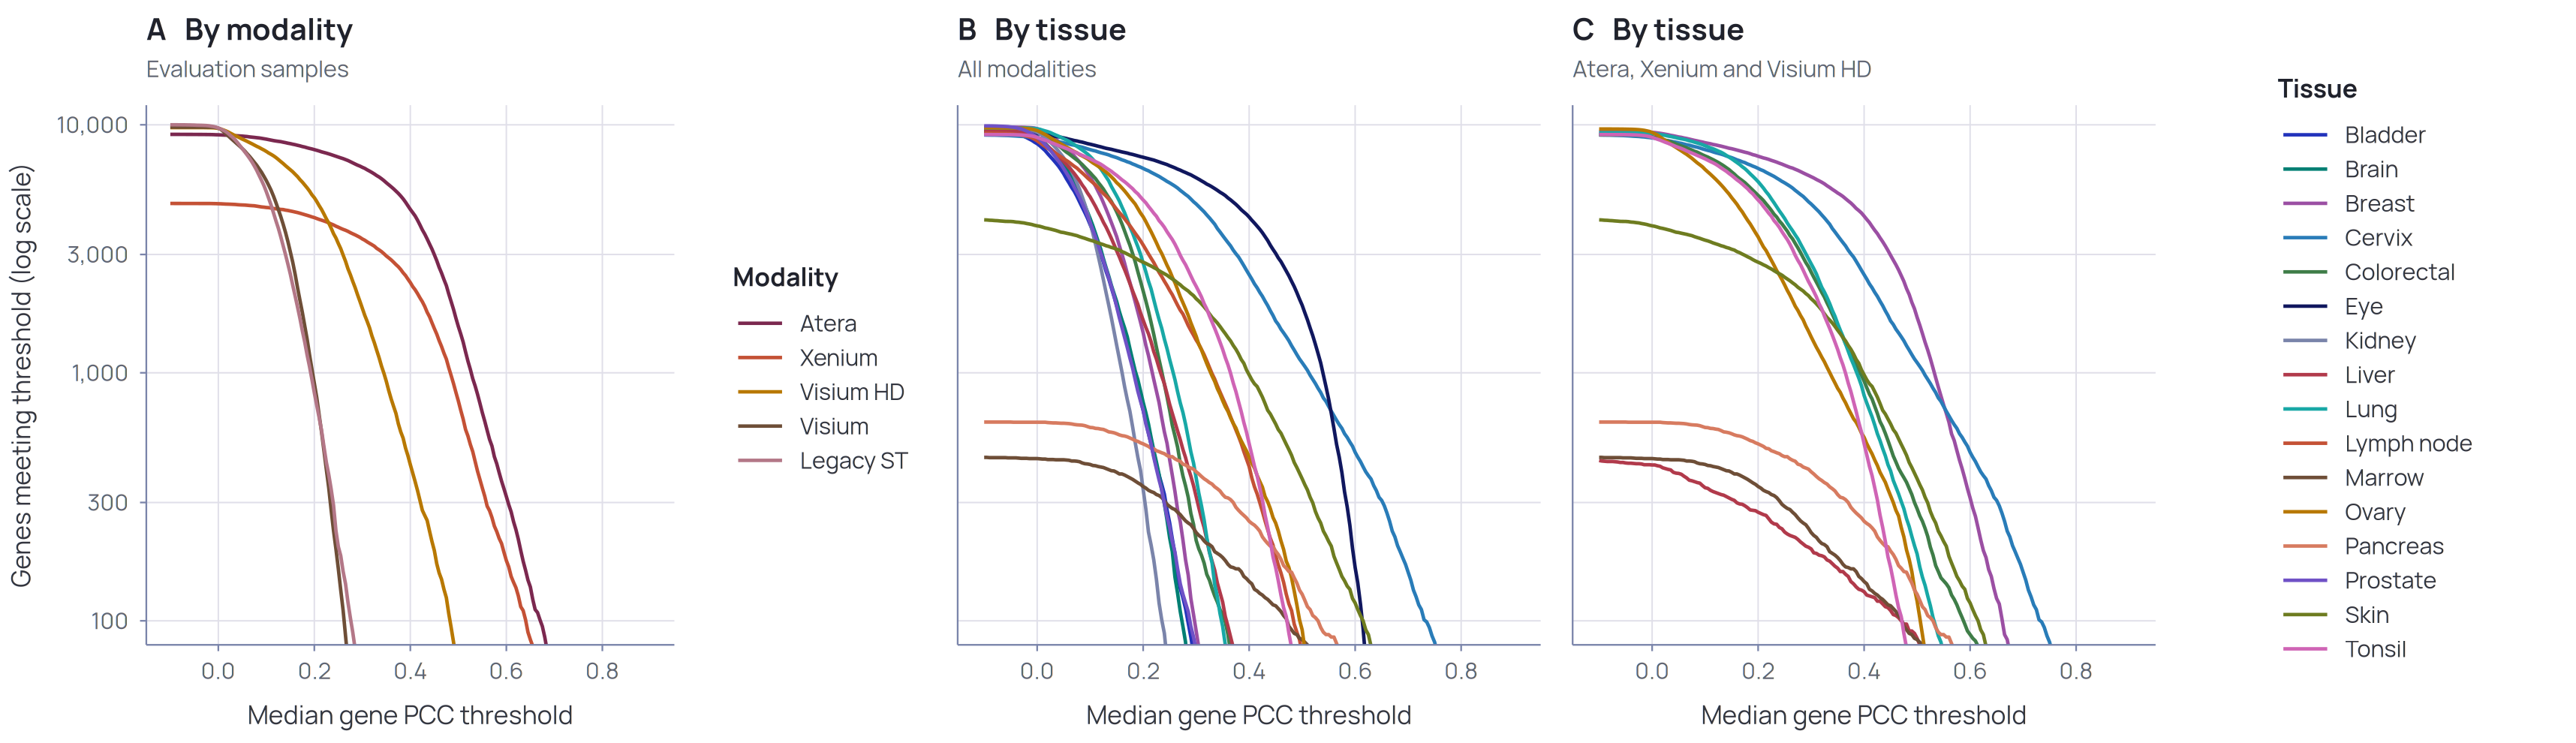
We also observed differences in performance across organ types. However, because our held-out cohorts were profiled using different assay technologies, tissue-specific effects could not be fully separated from platform-specific measurement limitations. We therefore define a confidence-based gene vocabulary for each organ, restricting predictions to genes that are reliably supported by the available validation data. We expect these vocabularies to expand as Holon-S1 is continually evaluated on larger cohorts generated with newer, higher-sensitivity assays.
Comparison to SOTA multimodal model
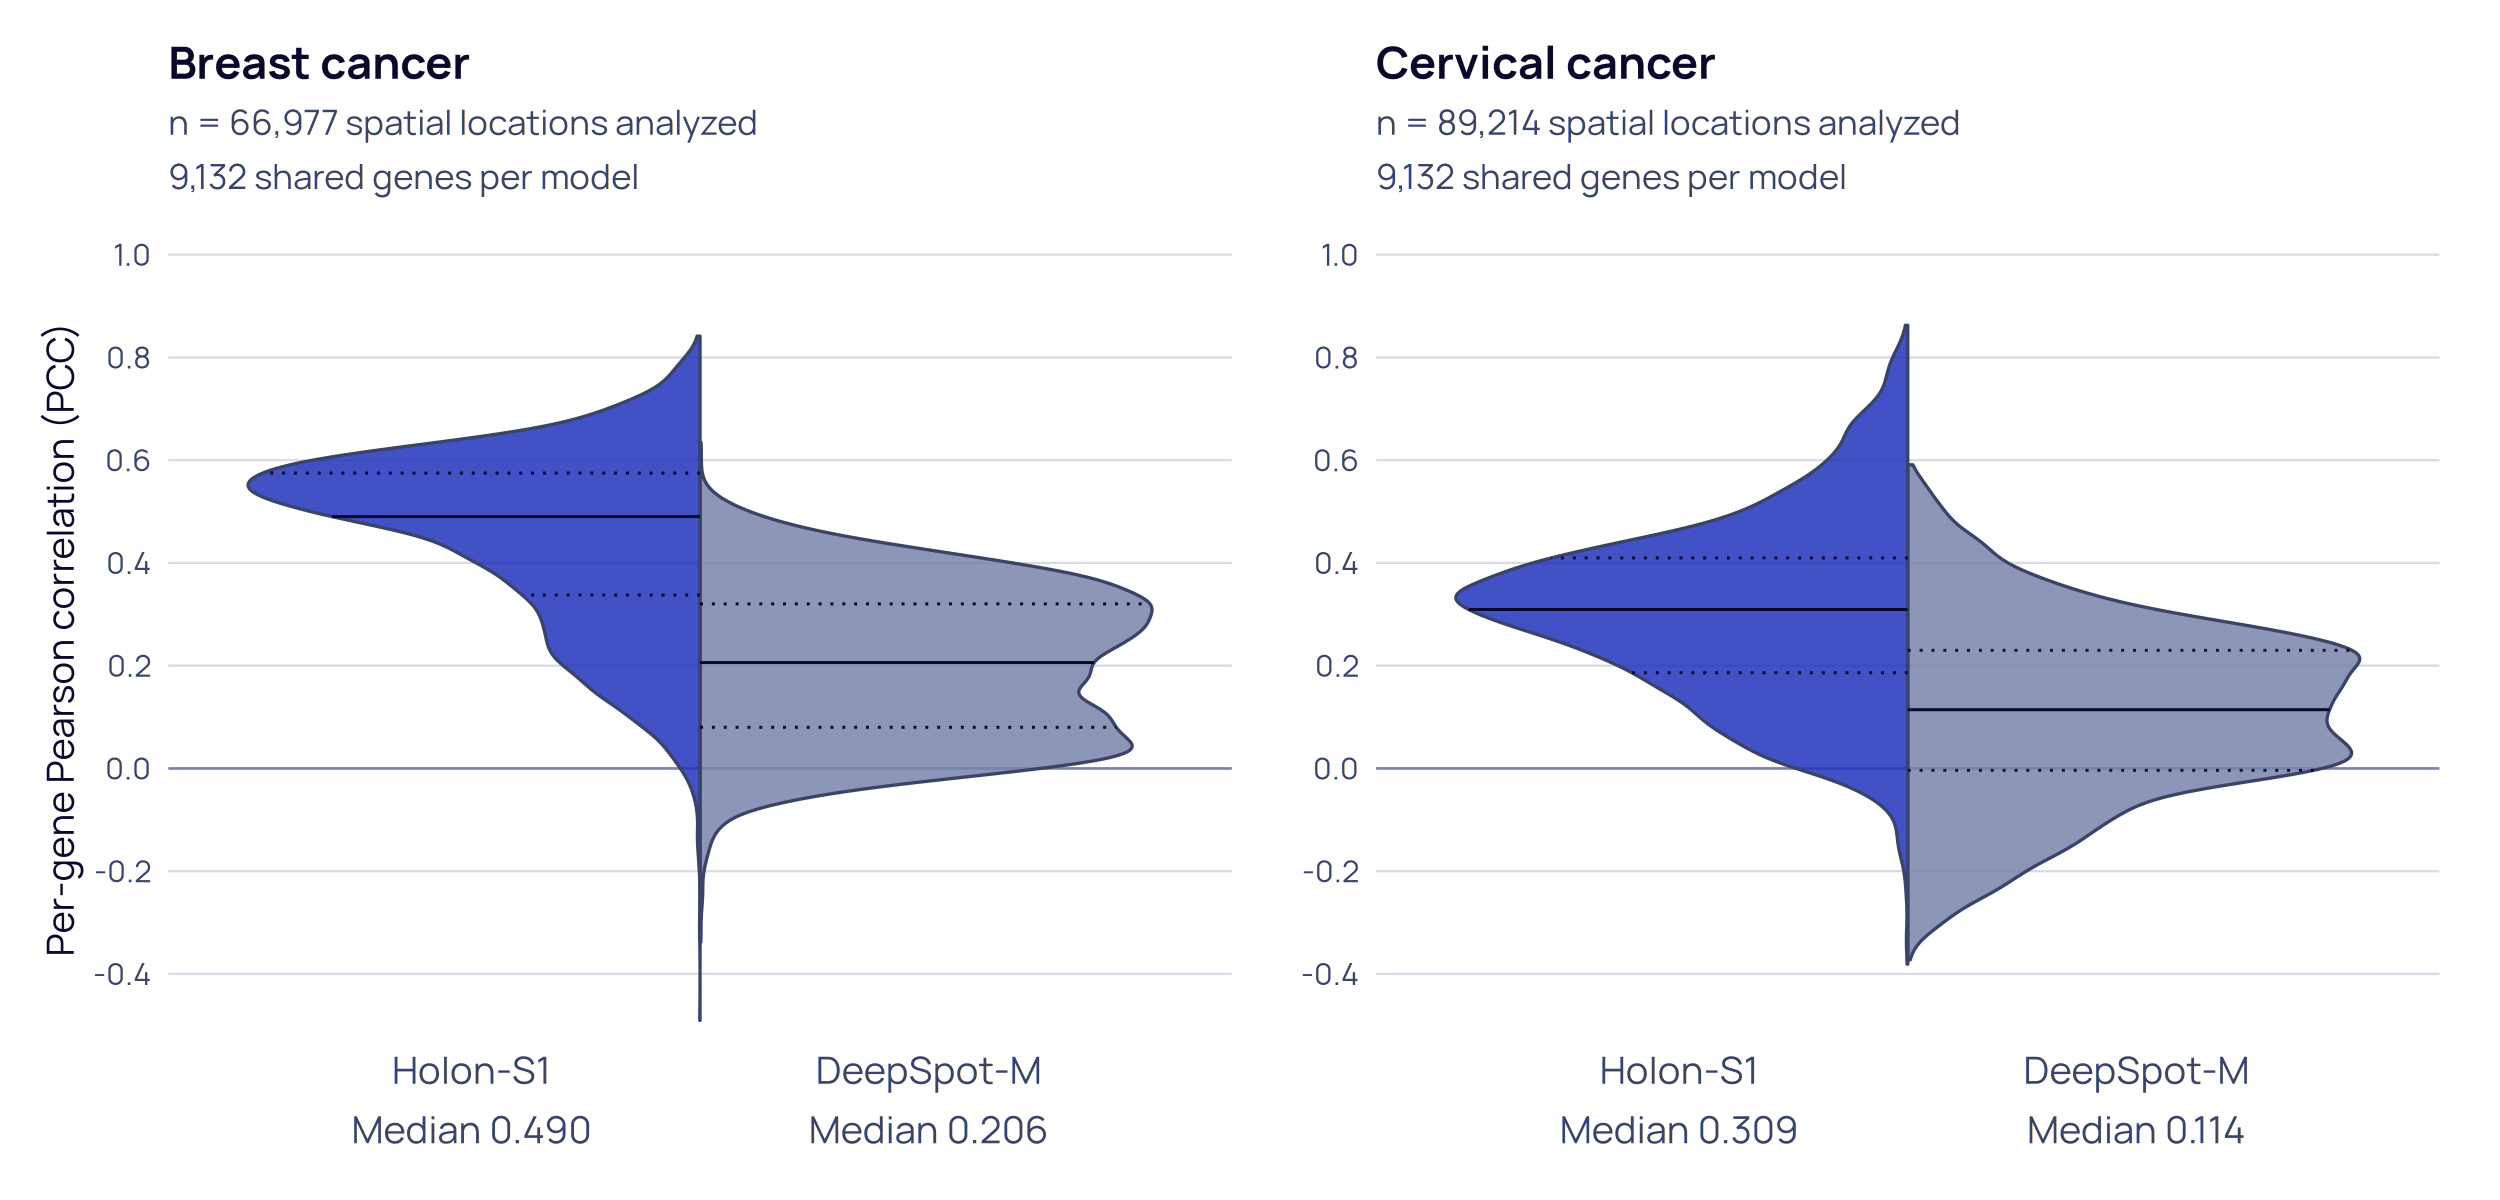
DeepSpot-M
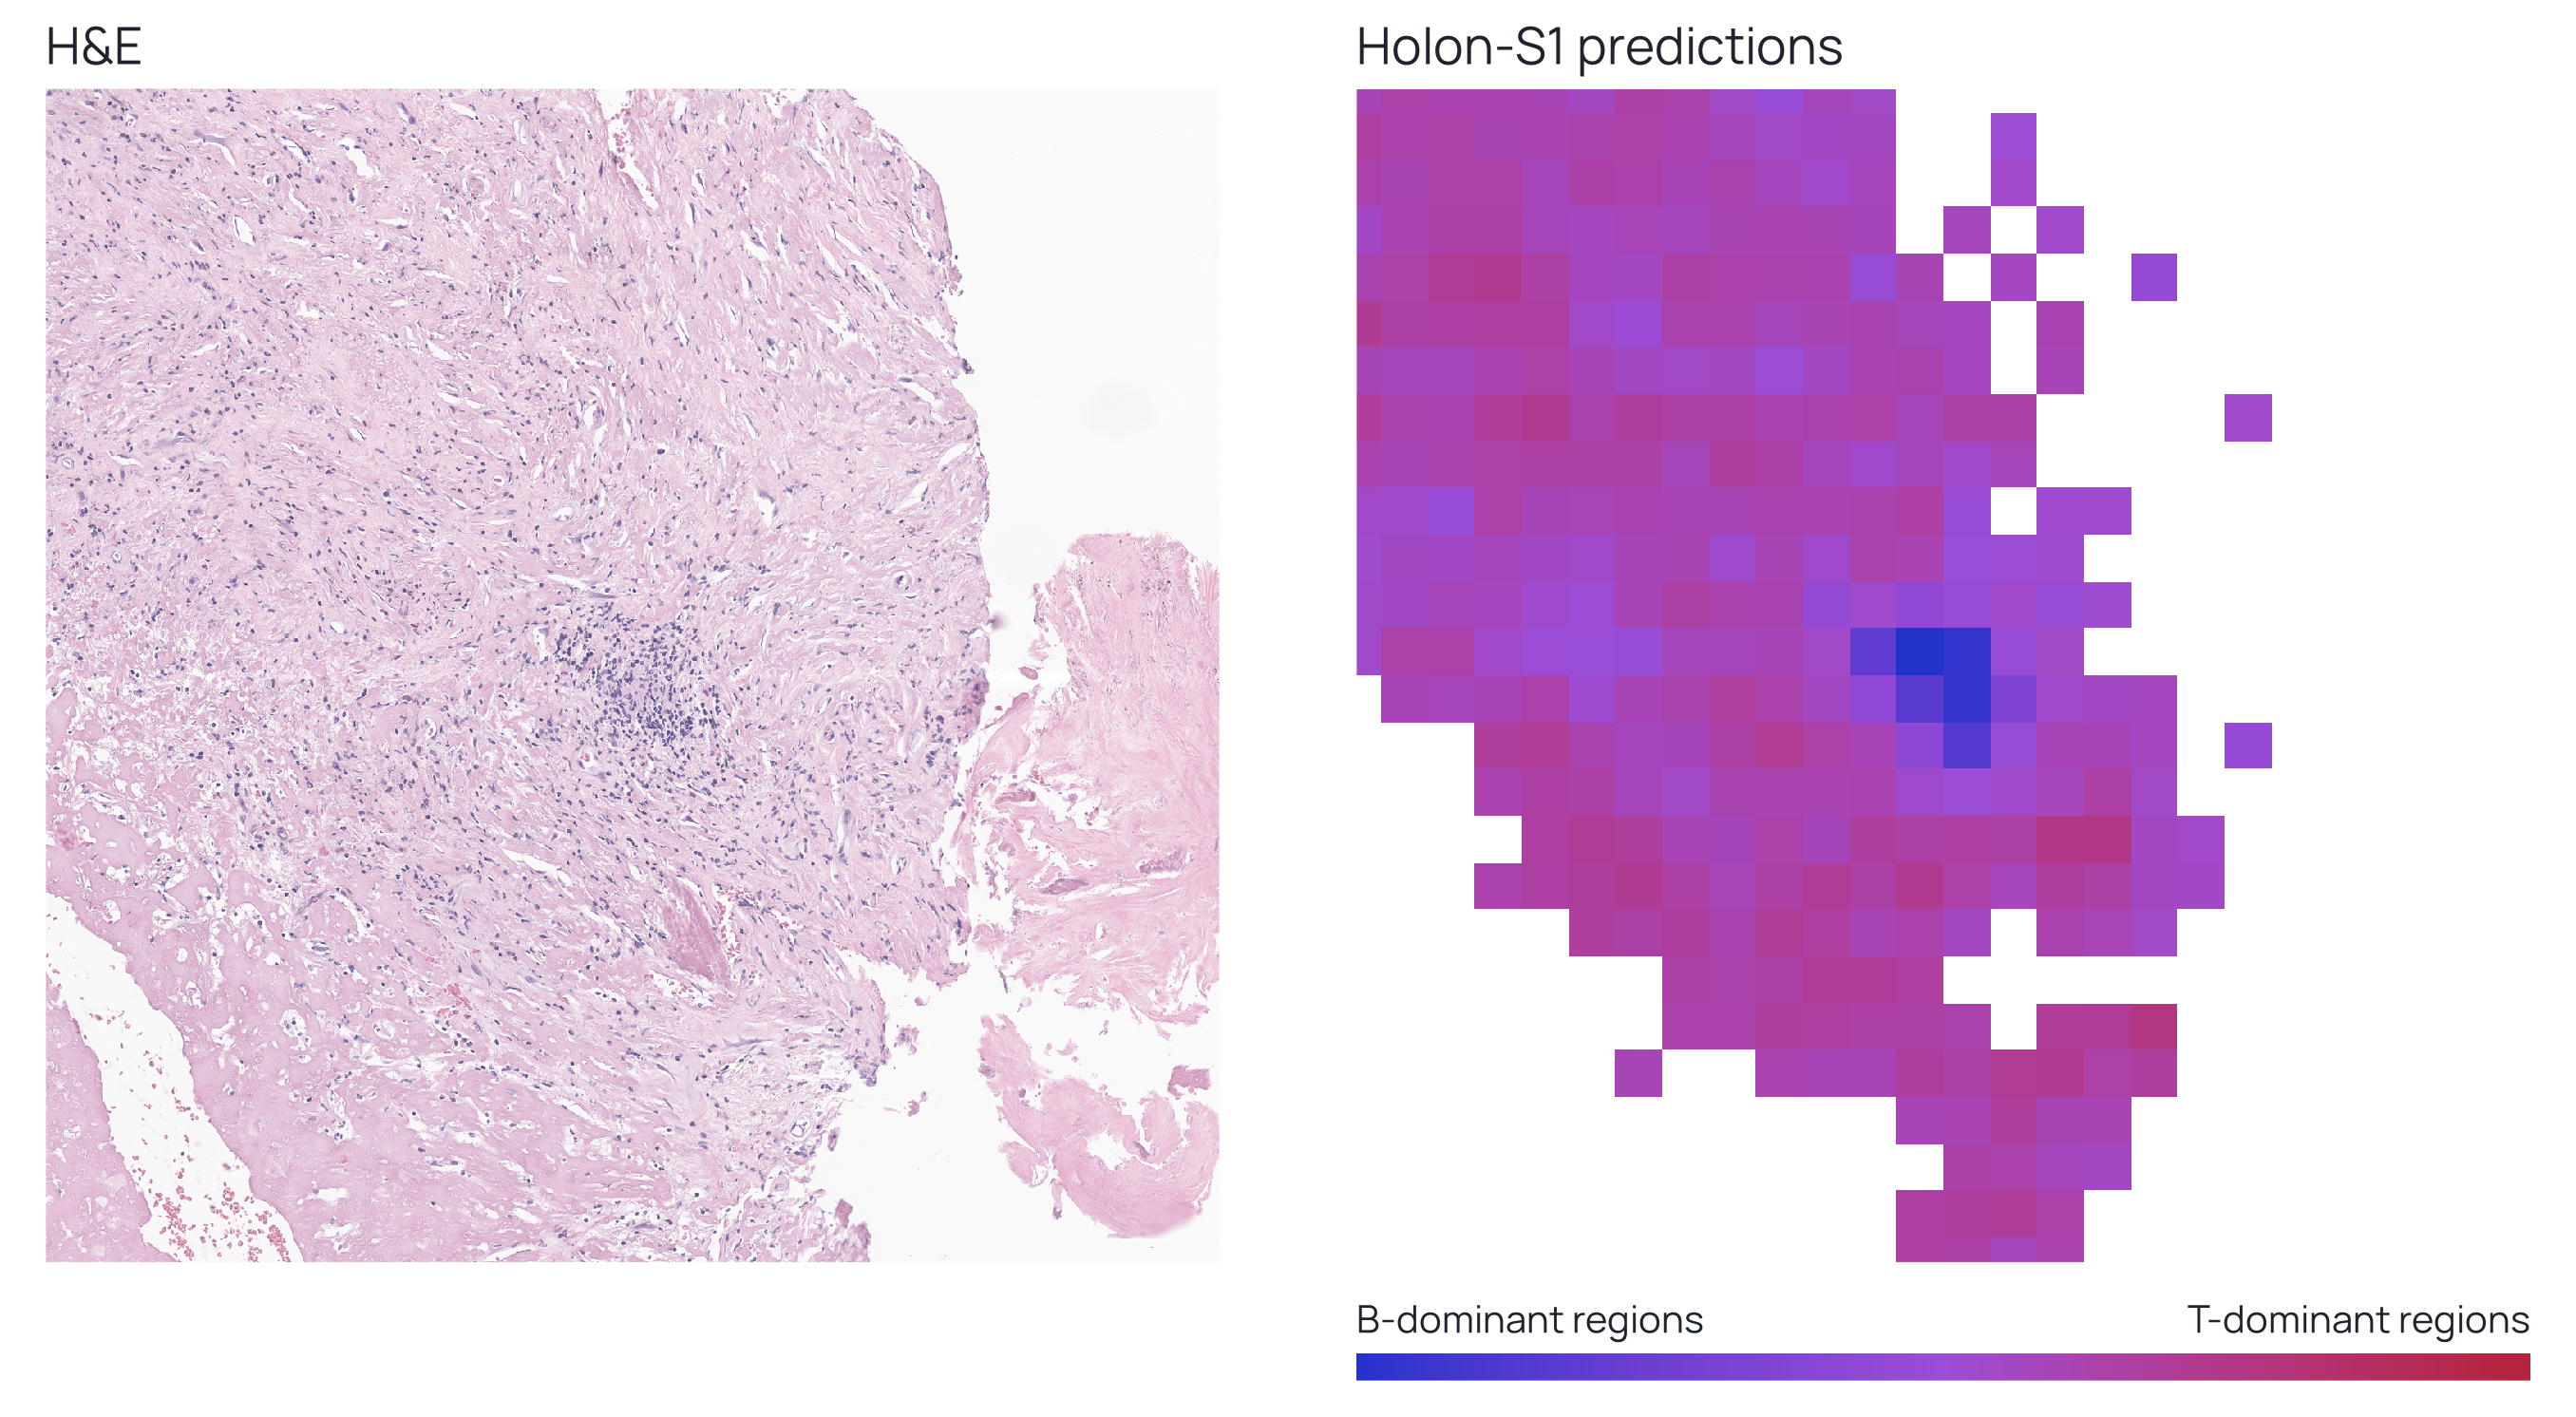
Distinguishing B-cell dominant regions in immune landscape
To support the identification of B-cell-dominant regions in Sijbrandij’s samples, we first evaluated the ability of Holon-S1 to distinguish B- and T-cell lineages from H&E images. These lymphocyte populations are difficult to distinguish reliably by morphology alone, and their identification typically relies on lineage-specific markers assessed by immunohistochemistry or multiplex immunofluorescence.
We therefore used the OrionCRC dataset
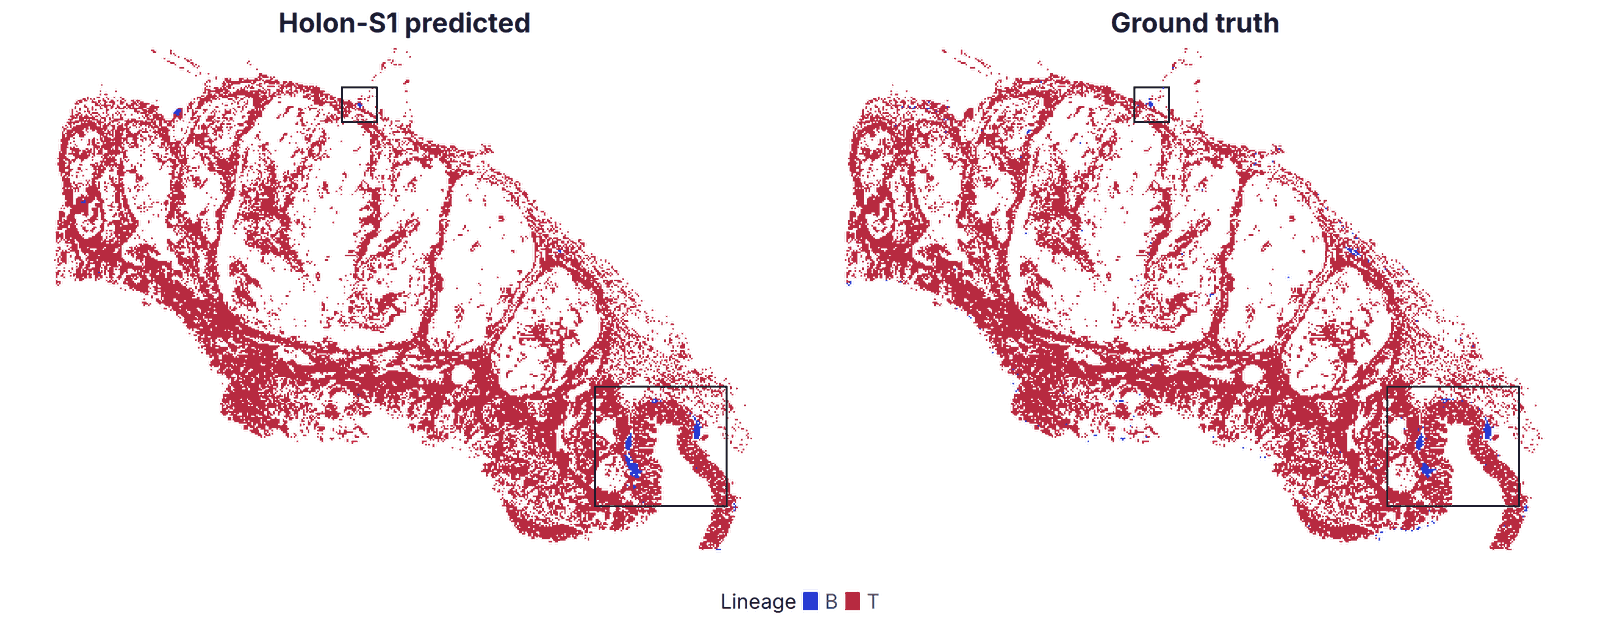
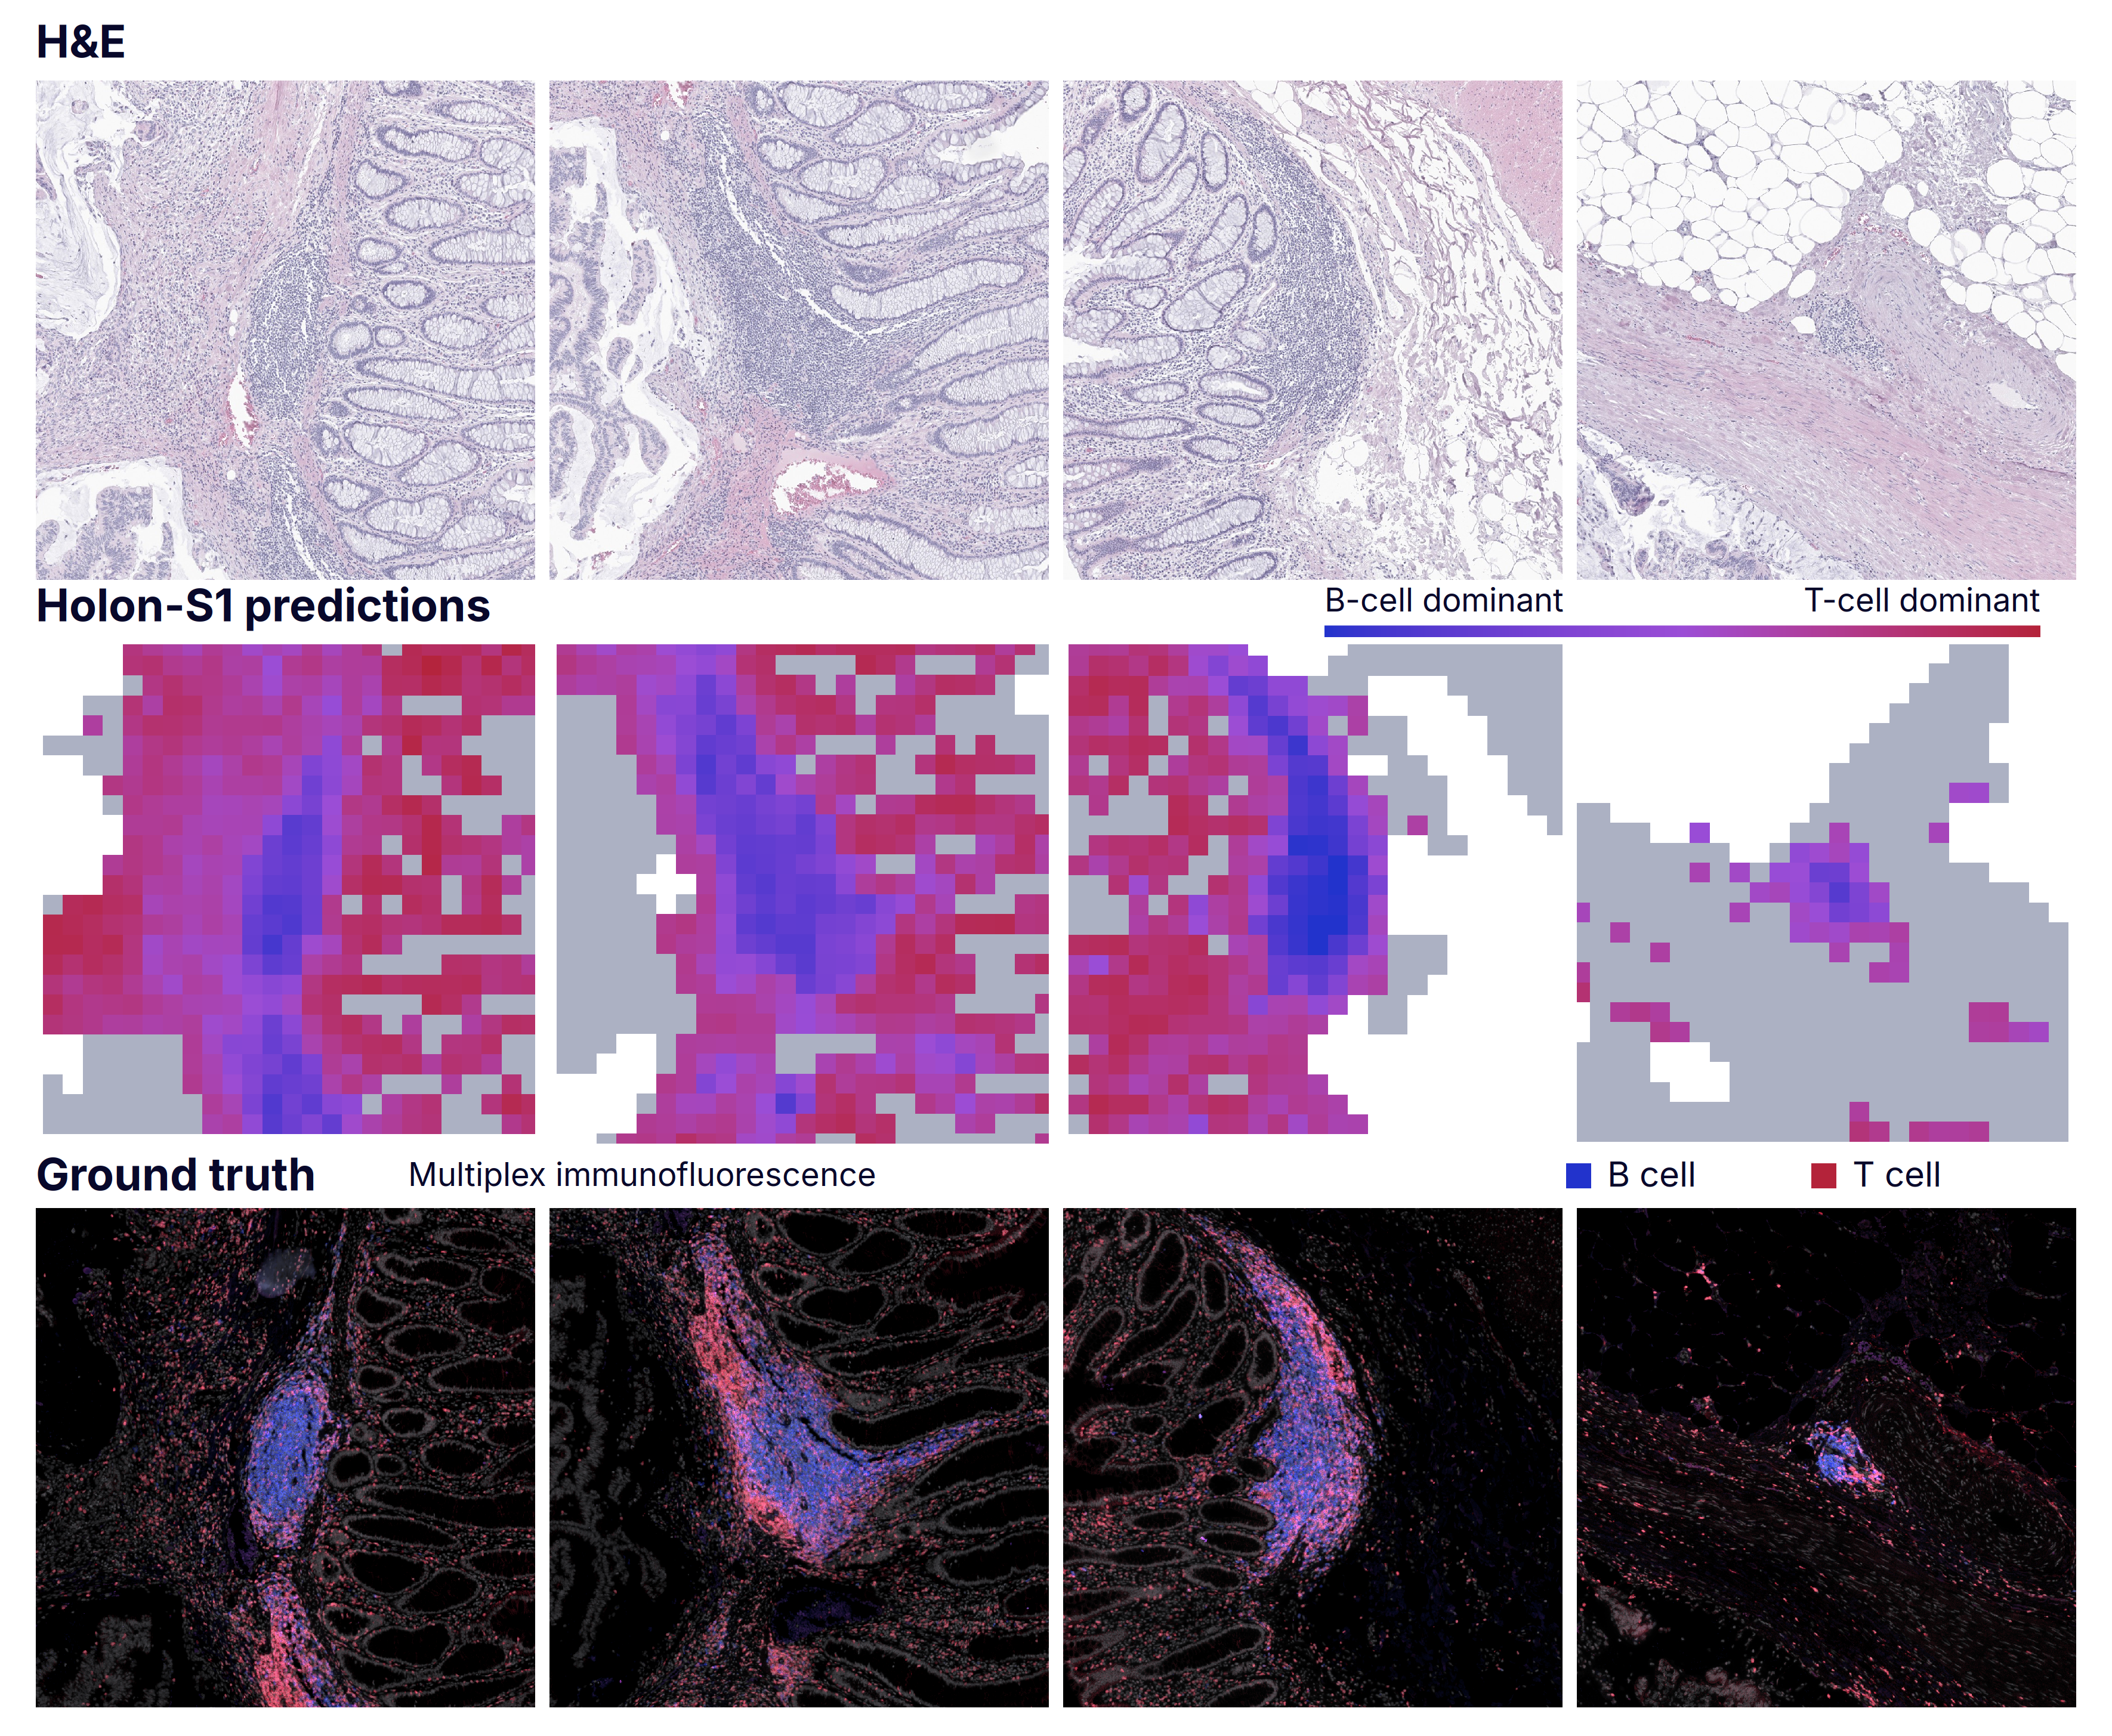
Because Holon-S1 infers gene expression at the regional rather than single-cell level, we evaluated its ability to distinguish T-cell-dominant from B-cell-dominant regions. Although these predictions do not resolve individual cell identities, they accurately distinguish regions by their dominant lymphocyte lineage. Current future directions include cell-level prediction models.
Analytical Validation and Robustness
Variations in tissue preparation, staining, and scanning across institutions pose a persistent challenge to the robustness of pathology foundation models. We evaluated Holon-S1 on slides with substantially degraded image quality and assessed prediction variability when the same biological specimens were scanned using different protocols.
Path2Space, published in Cell earlier this year
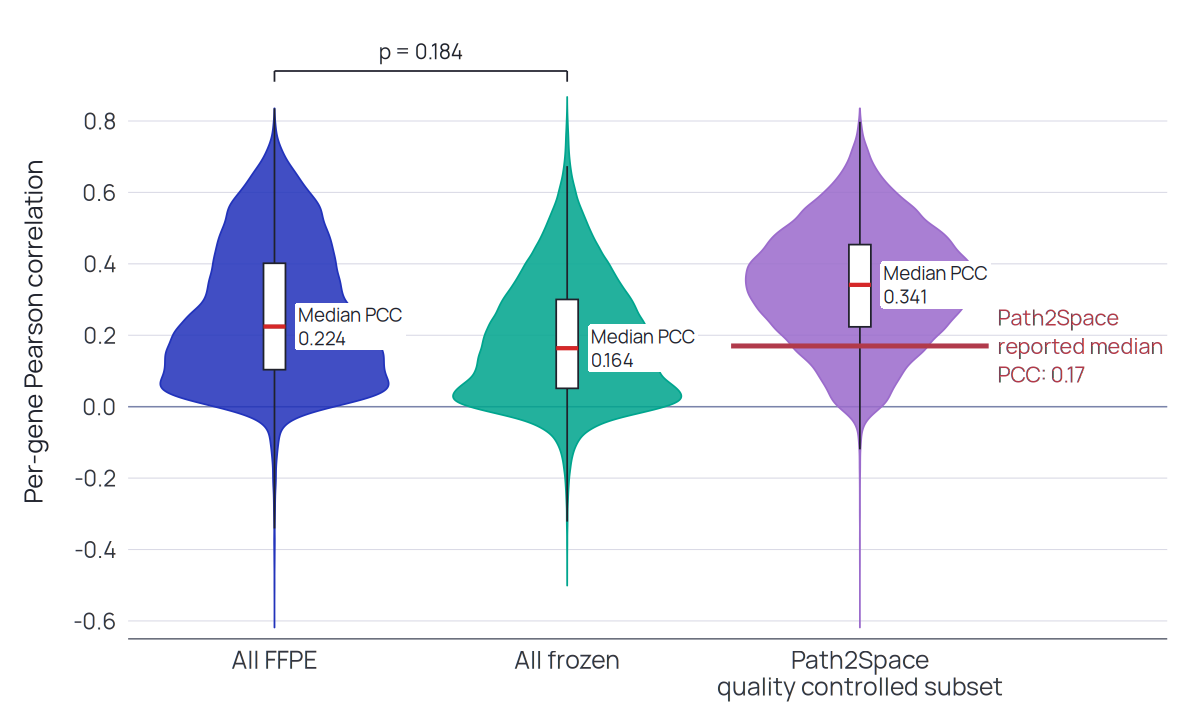
We wanted to evaluate Holon-S1 across all samples in the HTAN dataset, including those deemed too low quality by the Path2Space framework. For each slide, we summarized Holon-S1 prediction accuracy as the median per-gene Pearson correlation against log1p-transformed raw counts. We compared FFPE (n = 8 slides) and fresh-frozen (n = 31 slides) performance using a two-sided exact Mann–Whitney U test, without adjustment for within-patient clustering.
Holon-S1 achieved a higher median correlation than the reported Path2Space reference on the evaluated subset and maintained comparable performance on slides excluded by Path2Space’s quality-control criteria. Performance did not differ significantly between FFPE and fresh-frozen slides (p = 0.184).
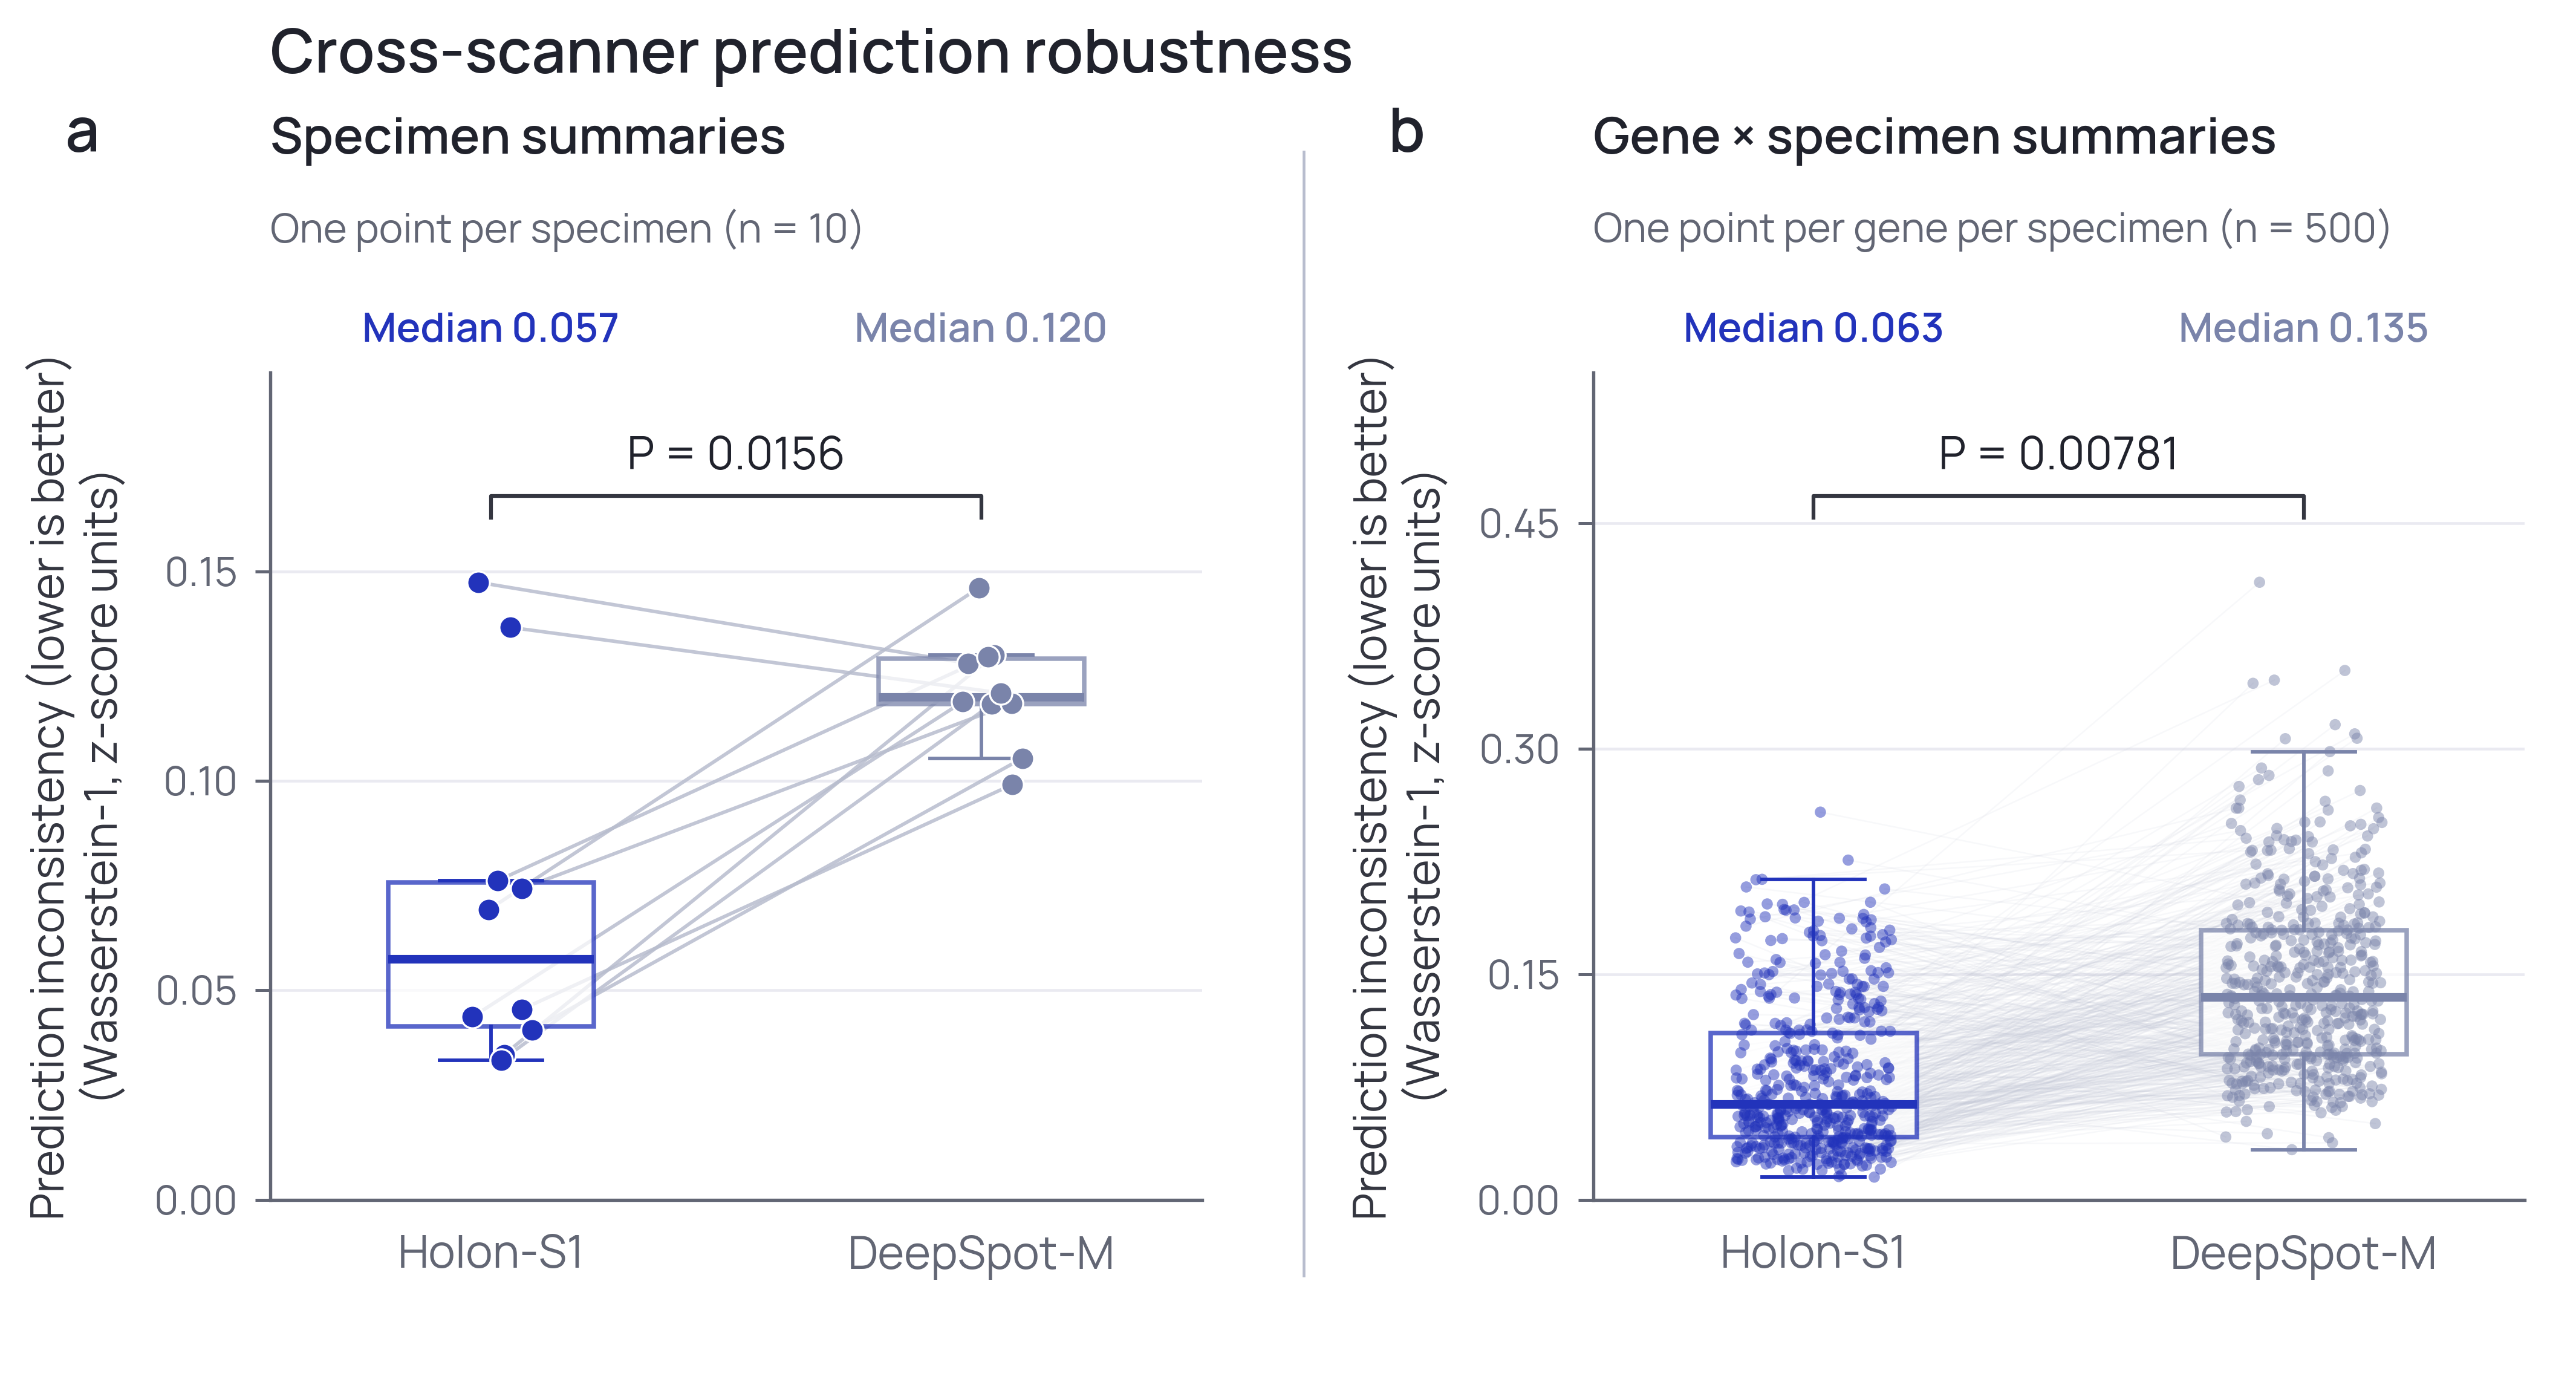
The various Holon-S1 gene-expression prediction evaluations presented above included slides acquired using more than 15 scanner models. To directly assess prediction consistency when the same tissue section was scanned on different systems, we used the PAR dataset
We randomly selected ten specimens and evaluated a fixed panel of 50 genes with strong prediction performance in both Holon-S1 and DeepSpot-M, determined in the comparison above. Both models were evaluated at identical tissue coordinates within each scan, produced by the same preprocessing pipeline, with shared artifact exclusions.
Because the scans were not spatially registered, we compared predicted expression distributions using Wasserstein-1 distance (WD)
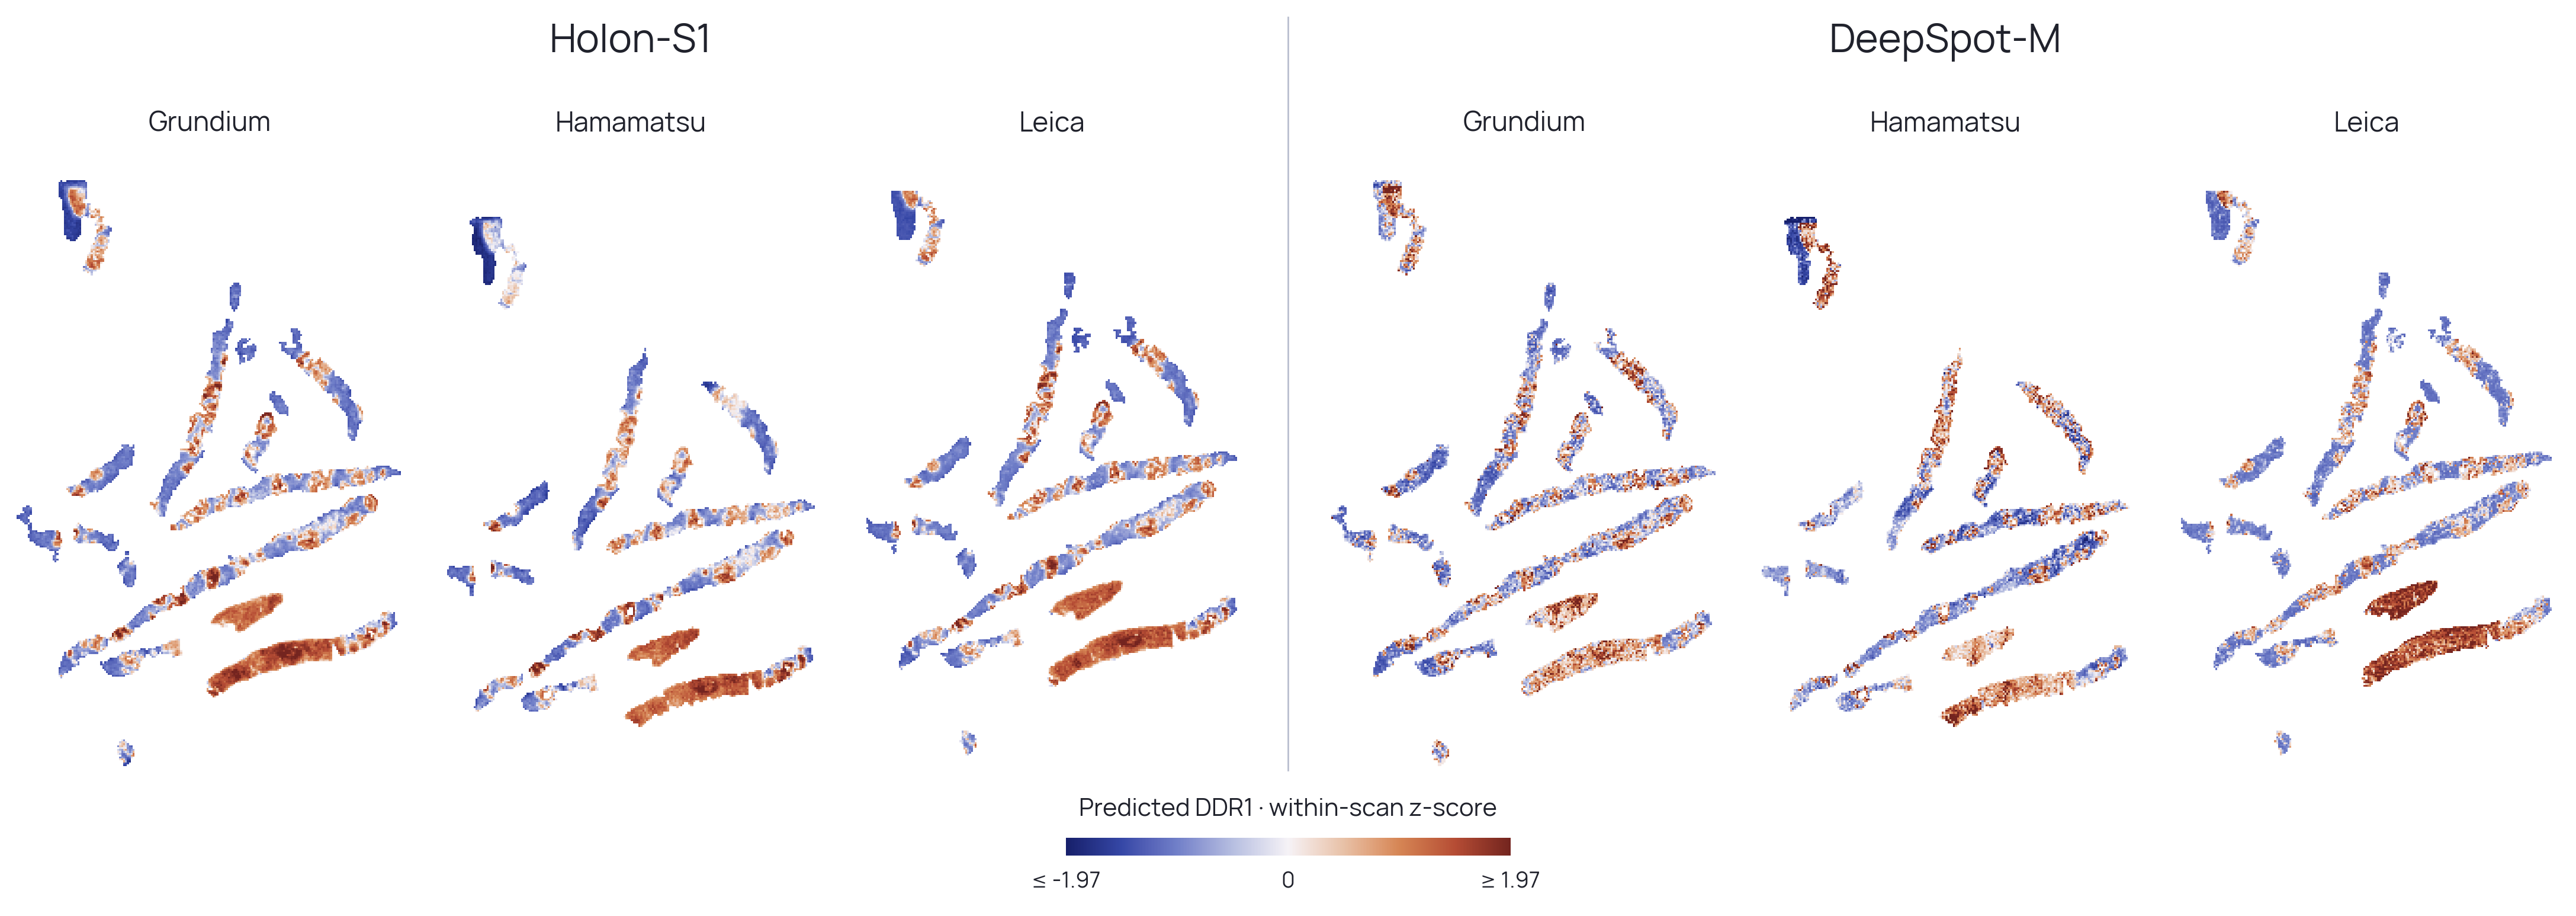
For qualitative assessment, we visualized DDR1 predictions in a separate illustrative specimen. DDR1 was selected before inspecting the PAR maps because it had the highest minimum prediction accuracy across both models. Maps were normalized to within-scan z-scores and displayed on a shared color scale without spatial smoothing. Holon-S1 showed more consistent regional patterns across rescans, whereas DeepSpot-M showed greater variation in relative regional contrast, particularly in the Leica scan.
Acknowledgements
We thank Dr. Jay Shi, Dr. Jacob Stern, and Dr. Jorge Reis-Filho for helpful scientific discussions. We especially thank Sid Sijbrandij for open-sourcing his cancer journey and helping foster more efforts toward helping patients realize the fruits of individualized precision medicine.
Citation
For attribution in research contexts, please cite this work as
Hassan Muhammad, Benjamin Warner, Paul S. Scotti and Tanishq Mathew Abraham. Holon-S1 Technical Report. Sophont Technical Report SOPHONT-TR-X-X, 2026. doi:X/zenodo.X. https://sophont.med/blog/holon/.
BibTeX citation
@techreport{muhammad2026holon,
  author = {Muhammad, Hassan and Warner, Benjamin and Scotti, Paul S. and Abraham, Tanishq Mathew},
  title = {Holon-S1 Technical Report},
  institution = {Sophont},
  number = {SOPHONT-TR-X-X},
  year = {2026},
  doi = {X.X/zenodo.X},
  url = {https://sophont.med/blog/holon/},
}