
Holon-S1 Decoding every patient’s hidden biology.
From routine clinical data.
Live decoding. Drag to explore. You can also focus the biopsy and use the arrow keys.
Our AI helps reveal what makes a tumor unique.

Proliferation
Hypoxia
Cytotoxic
DNA repair
Apoptosis
Inflammation
Interferon
Angiogenesis
Metabolism
Cell stress
Tissue from a biopsy or surgery is prepared on a slide—a routine part of cancer diagnosis.
The animation starts with a routine pathology slide prepared from tissue collected during biopsy or surgery. A scan line indicates image-feature extraction on the tissue. Registered gene maps settle onto the slide, which becomes a colored biological-program map. Program labels illustrate the breadth of coordinated processes that can be studied. The same slide stays in place as six applications appear: expand existing gene panels, discover response biomarkers, explain treatment response, stratify patients for trials, prioritize therapeutic targets and develop clinical tests. These are potential research uses, not validated clinical decisions for this sample. The glass layers illustrate relationships between two-dimensional data.
Making precision medicine more accessible.
Two paths to the same biological insights
Traditional testing for a well-resourced few
- High costs
- Tissue specimen(if enough available)
- Sequencing
- Research team
- Time
- Biological insights
With Holon-S1
- Routine slides
- Holon-S1
- Biological insights
No new gene tests or tissue samples needed
for everyone
Biological insights
then
Tailored treatment
Case study: Retrospective analysis of osteosarcoma in a real patient.
In 2022, Sid Sijbrandij was diagnosed with osteosarcoma (bone cancer). He spent years exploring his cancer’s biology with a dedicated team and extraordinary resources, and as of 2025 reports no evidence of disease. See what Holon-S1 was able to find from retrospectively analyzing Sid’s original 2022 H&E tissue. (Learn more about Sid’s story)
Each dot will represent a gene’s activity predicted by Holon-S1 from Sid’s 2022 H&E tissue.
Sid’s team wanted to study B-cell markers, but their genomic panel lacked the information needed. Holon-S1 predicts these markers from tissue images.


Put Holon-S1 to work on your data.
Bring existing slides, a cohort, or a pathology model you want to interpret. Tell us what you want to investigate.
Map gene activity from existing slides.
Predict spatial gene activity from routine H&E, whether molecular profiling was never performed or an earlier panel did not include genes of interest. Investigate new questions without running a new molecular assay.
Validated on
FFPE & fresh frozen
slides
Works with archived slides
16
organ types
Pan-cancer coverage
15+
scanners
Robust across your workflow
Discover biomarkers of treatment response.
Most foundation model workflows pool tissue-image features without explicitly modeling their spatial arrangement. Holon-S1 preserves that arrangement and predicts where genes are active. Here we show why this matters in a triple-negative breast cancer cohort: coherent spatial organization of predicted EREG was associated with pathologic complete response to neoadjuvant chemotherapy.
Response to neoadjuvant chemotherapy
In TNBC, stromal tumor-infiltrating lymphocytes (sTIL) are a widely used measure of antitumor immune activity associated with response to neoadjuvant chemotherapy. Here, computational estimates of the percentage of stromal tissue occupied by lymphocytes and plasma cells provide a benchmark for the EREG biomarker.
Drag to rearrange predicted EREG activity in a responder’s tissue map while keeping total expression unchanged.
Bulk EREG expressionunchanged
Spatial gradient0.39 · coherent
Marker predictionresponder
The same gene can tell a different story.
Holon reads not only how much EREG is present, but how its expression is arranged across the tissue.
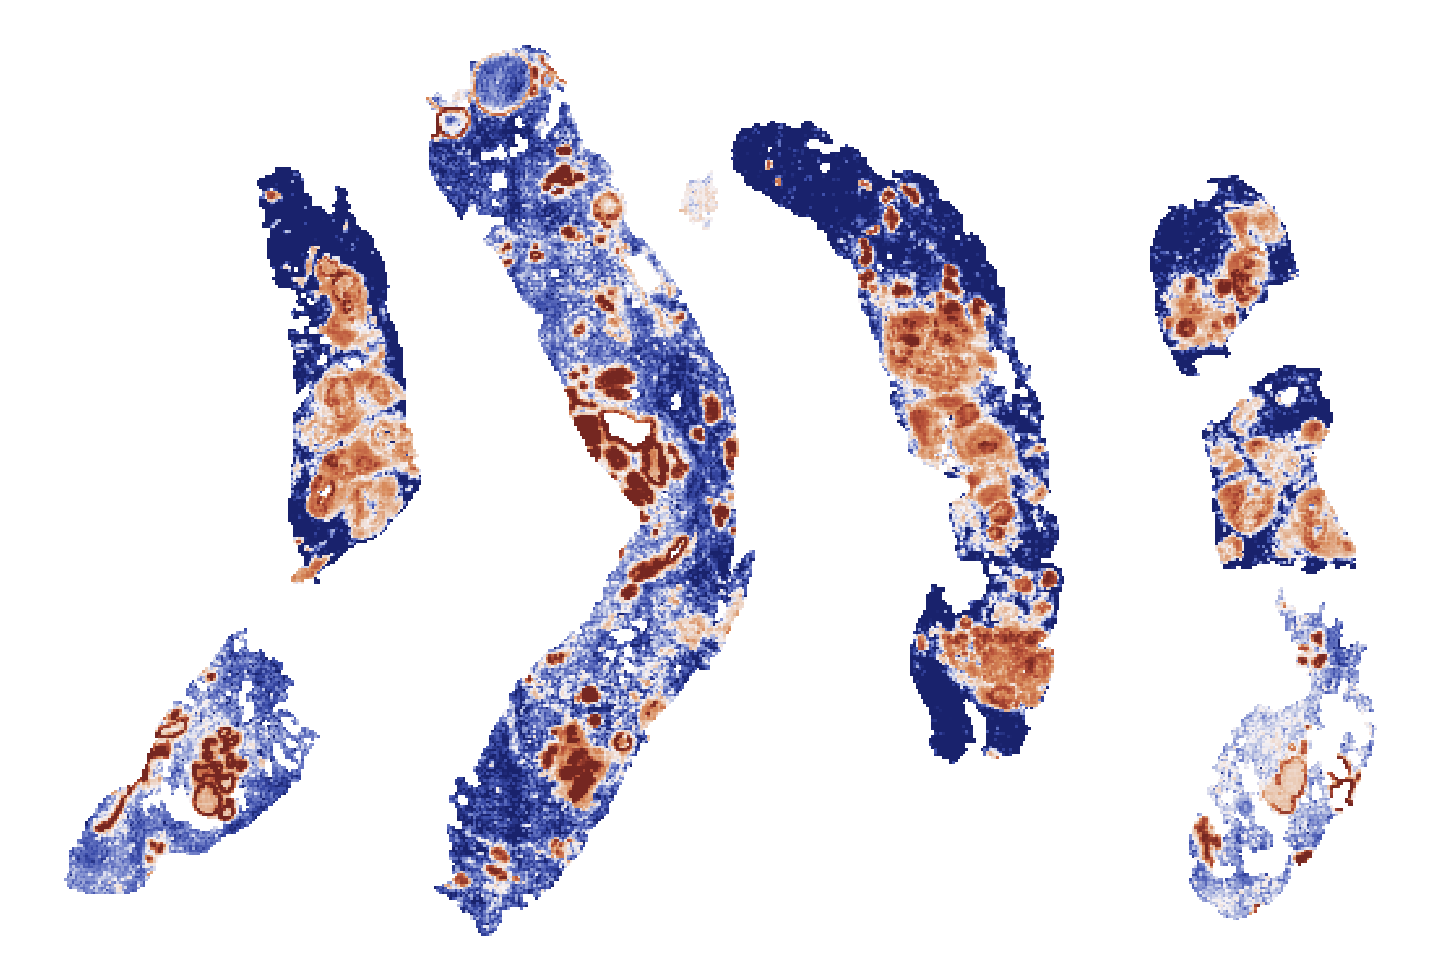
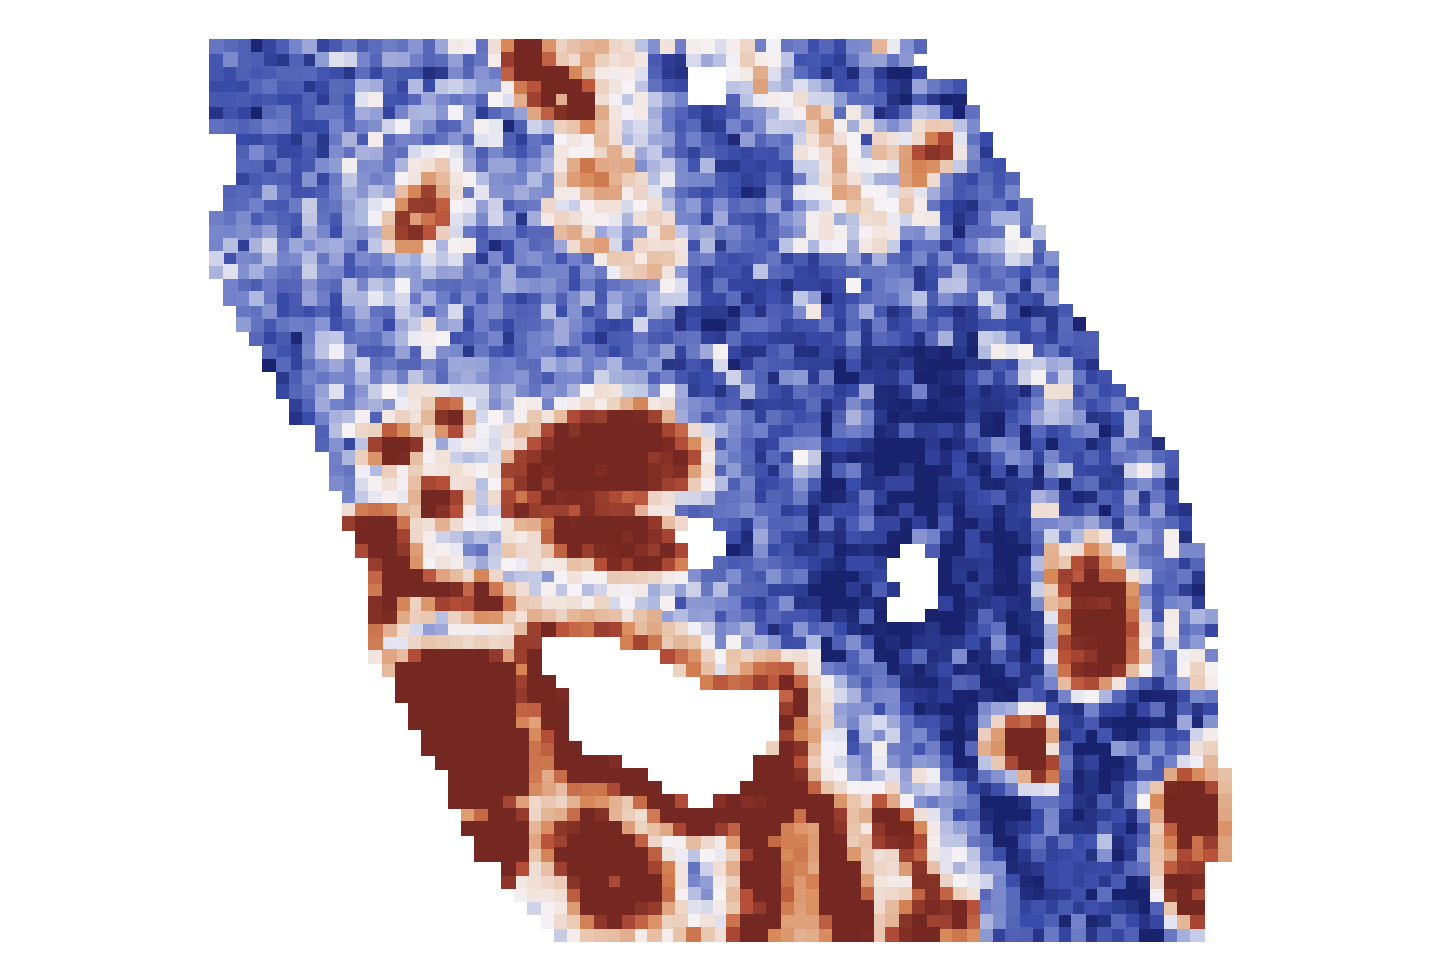 Sharp boundary and larger concentrations
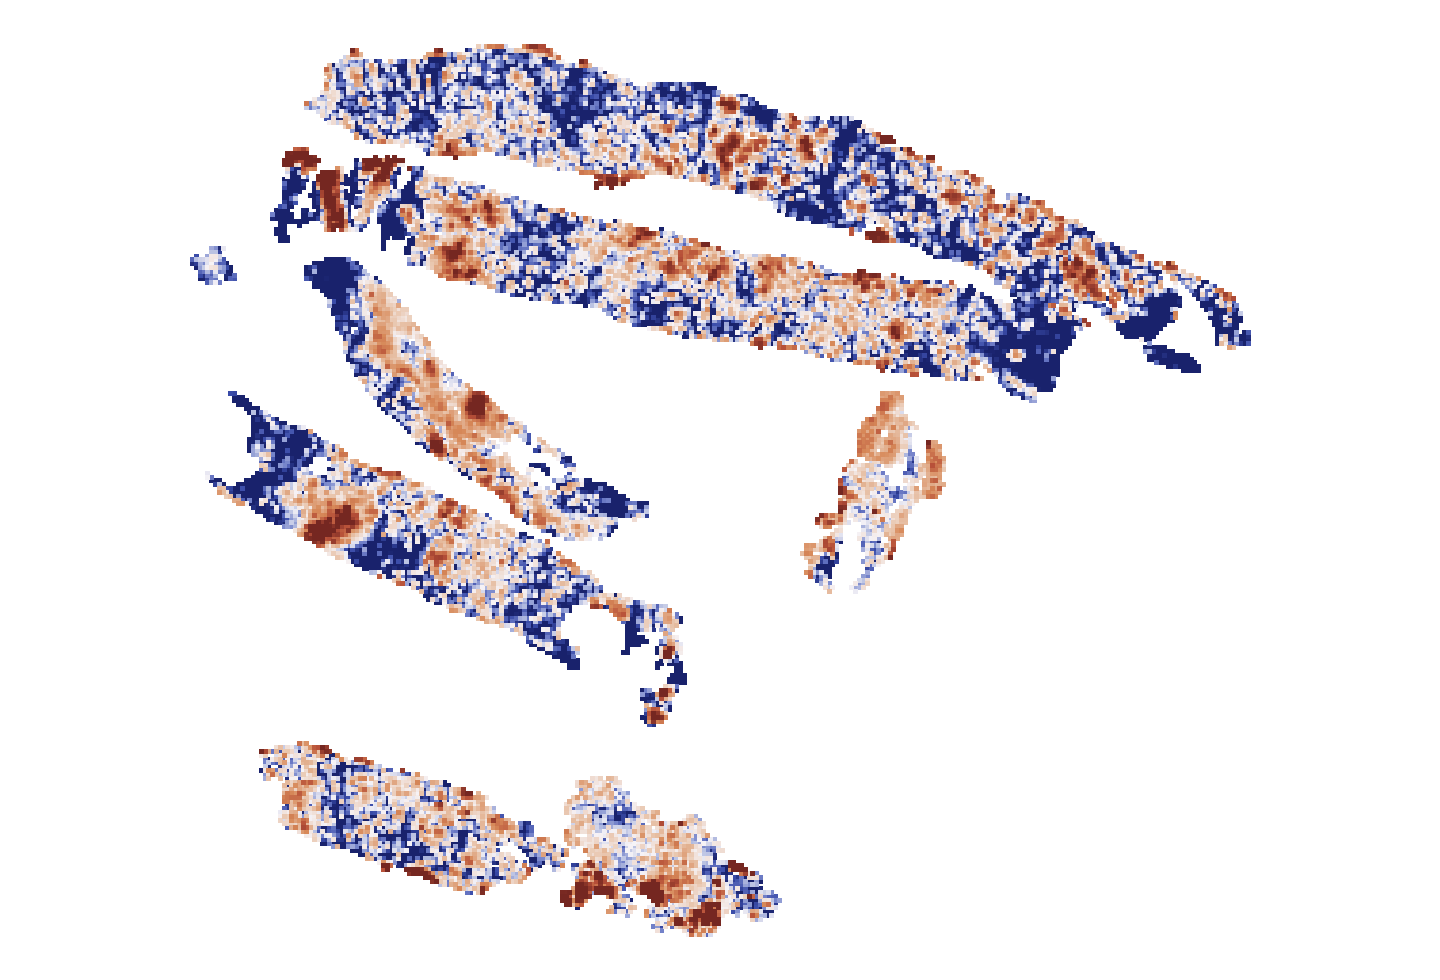
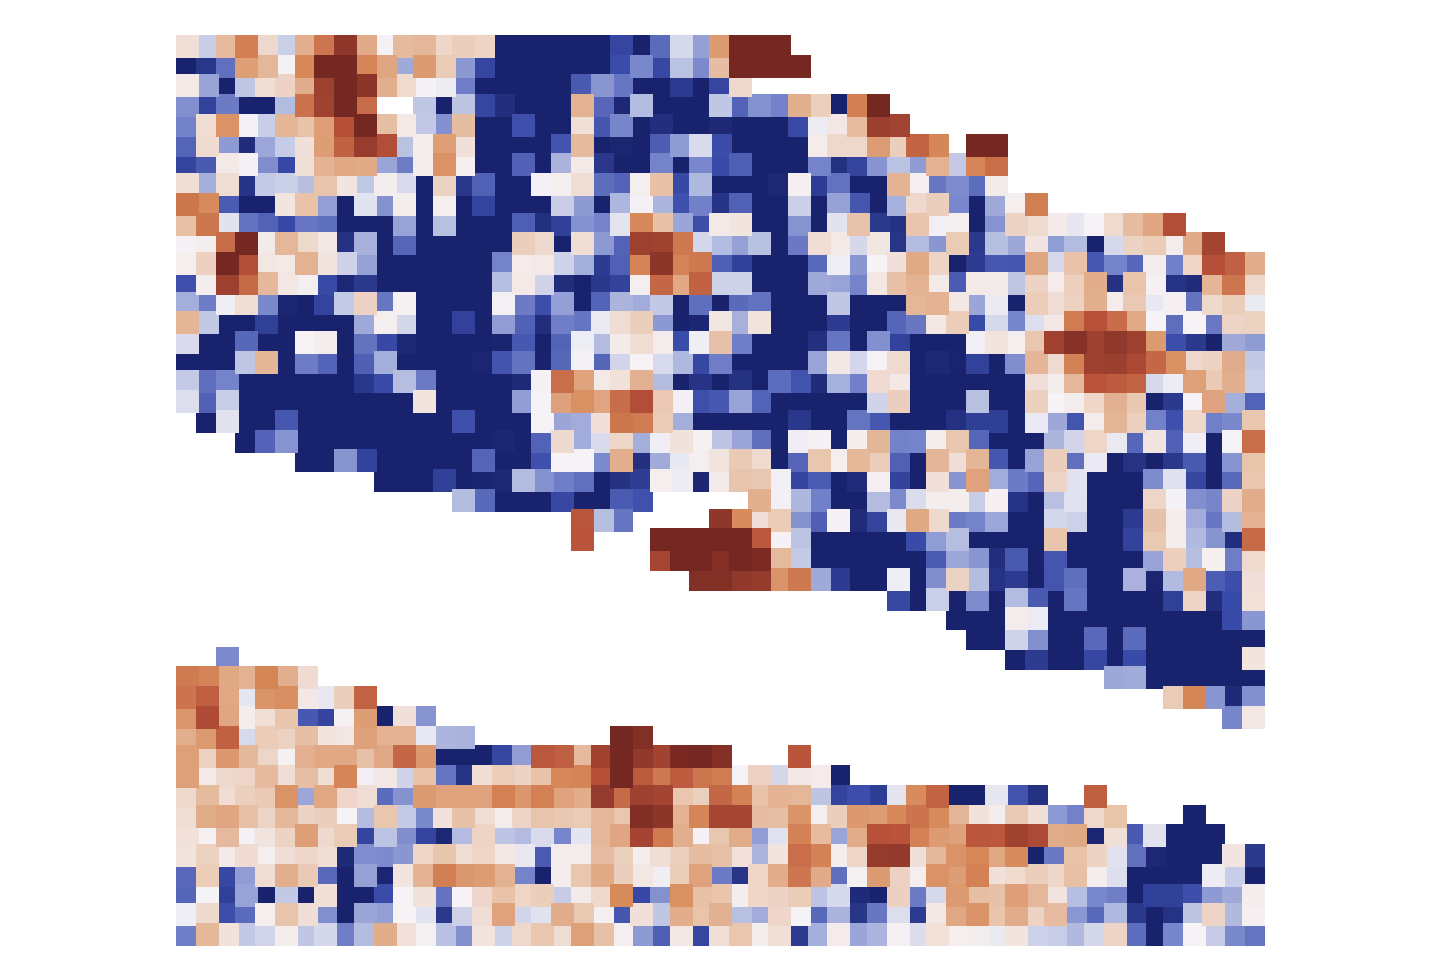 Speckled field, smaller concentrations
EREG has been linked to chemotherapy sensitivity in other cancers. Holon-S1 identified its spatial pattern as a candidate response marker in breast cancer for the first time. Read about our methods and explore more results in the technical report
Connect your model’s predictions to biology.
Holon-S1 can combine tissue morphology with predicted gene activity and biological pathways to investigate risk groups in an interpretable manner. Here we use Holon-S1 to analyze biological differences between patient groups stratified by a colorectal cancer prognostic model.
- Loading biological programs…
Predicted tissue share (%)
Each bar is one patient
Loading patient compositions…
Get in touch.
Discuss your studyAre you a physician-scientist or academic researcher with an idea for using Holon-S1 in your work? Get in touch, we’re seeking collaborators to show off what Holon-S1 can do.